USD/CAD – 1.3235
USD/CAD – Wave v ended at 0.9407 and a-b-c correction may extend gain to 1.4700
As the greenback has retreated after faltering below indicated resistance at 1.3456, retaining our bearish view that the fall from 1.3535 (last month’s high) is still in progress, hence consolidation with downside bias remains for weakness to previous resistance at 1.3210-12 (now support), however, only a break below this level would suggest the rebound from 1.2969 has ended and prolong choppy trading, bring subsequent weakness to 1.3100 but downside should be limited to 1.3056 support and price should stay well above psychological support at 1.3000, bring rebound later.
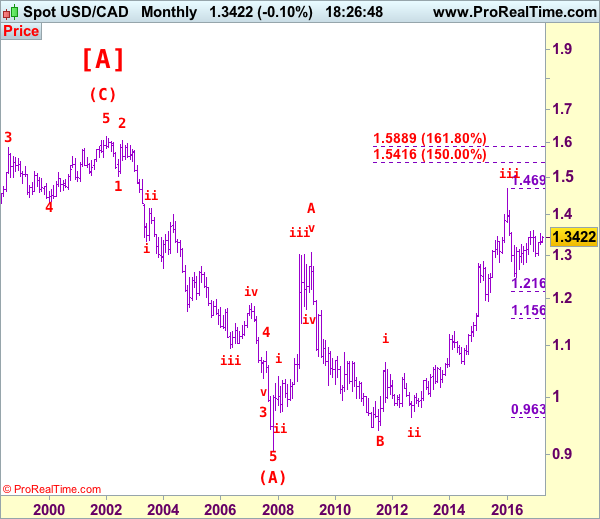
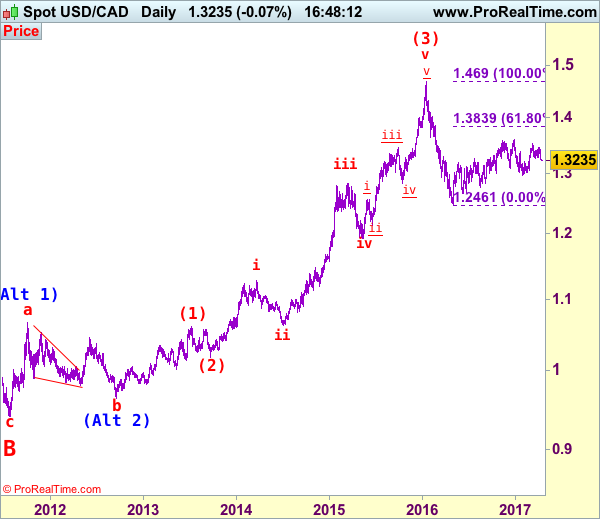
We are keeping our view that the wave b from 1.0657 (a leg top) has possibly ended at 0.9633 with (a): 0.9800, wave (b): 1.0447 and wave c at 0.9633, the subsequent rise from there is now treated as wave c exceeded indicated upside target at 1.3770-80 and 1.4000 and wave (3) has possibly ended at 1.4690 and wave (4) correction has commenced for retracement back to 1.2832 support, then 1.2410-20.
On the daily chart, our latest preferred count remains that the A of (B) rally from 0.9059 low (7 Nov 2007) unfolded into an impulsive wave with i: 0.9059-1.0380, ii ended at 0.9819, iii at 1.3019 followed by triangle wave iv at 1.2026 , then wave v formed a top at 1.3066 and also ended the wave A. The wave B is unfolding as an double three a-b-c-x-a-b-c and is sub-divided as a: 1.2192, b: 1.2716 and wave c at 1.0784, followed by wave x at 1.1725, another set of a-b-c unfolded with 2nd a at 0.9931, 2nd b at 1.0674. the 2nd c has possibly ended at 0.9407, therefore, consolidation with upside bias is seen for major correction, indicated target at 1.3900 had been met and gain to 1.4700 would follow.
On the upside, expect recovery to be limited to 1.3370-75 and bring another decline. Above 1.3455-60 would suggest the retreat from 1.3535 has ended instead, bring a stronger rebound to 1.3500, then retest of 1.3535. A break of this resistance would revive bullishness and signal the rise from 1.2969 is still in progress for retest of 1.3599 top, once this level is penetrated, this would confirm the erratic rise from 1.2461 low has resumed for a stronger correction of early decline from 1.4690 (2016 high) to 1.3700 and later towards 1.3790-00, however, reckon upside would be limited to 1.3835-40 (61.8% Fibonacci retracement of 1.4690-1.2461) and bring retreat later.
Recommendation: Hold short entered at 1.3390 for 1.3190 with stop above 1.3360.
Longer term – The selloff from 1.6194 (21 Jan 2002) to 0.9059 (07 Nov 2007) is viewed as (A) wave which is a 5-waver as labeled on the monthly chart as below, the subsequently rally is labeled as (B) with impulsive A leg of (B) ended at 1.3066, wave B of (B) is unfolding which has either ended at 0.9407 or would extend one more fall but downside should be limited to 0.9200 and 0.9000 should hold.