EUR/JPY – 133.28
Despite this week’s initial marginal gain to 133.89, renewed selling interest emerged there and the pair has dropped sharply from there, price broke below previous support at 132.26, dampening our bullishness and signaling the retreat from 134.38 is still in progress, hence weakness to 131.72 support cannot be ruled out, however, as broad outlook remains consolidative, reckon downside would be limited and support at 131.17 should remain intact, bring another rebound later. Only below said support at 132.26 would abort and signal the rebound from 131.17 has ended, bring weakness to support at 131.72, then towards 131.17. Once this support is penetrated, this would suggest a temporary top is formed, bring retracement of recent rise to previous support at 130.62, then towards 130.00 later.
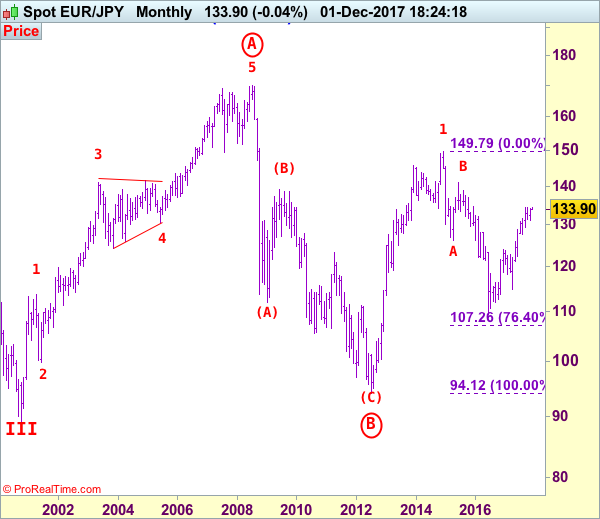
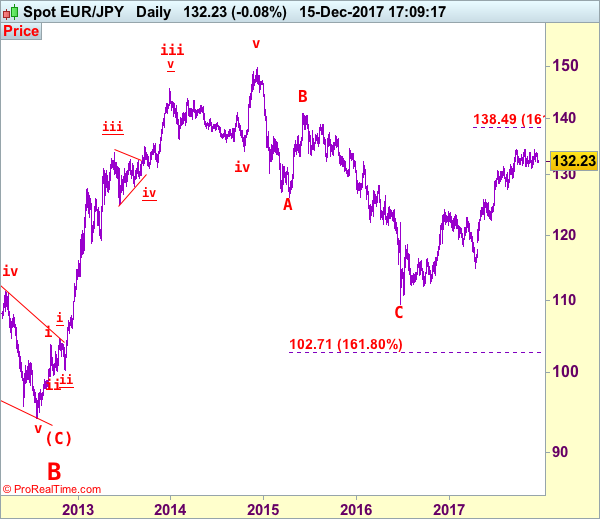
The daily chart is labeled as attached, early selloff from 169.97 (July 2008) to 112.08 is wave (A) of B instead of end of entire wave B and then the rebound from there to 139.26 is wave (B), hence, wave (C) has possibly ended at 94.12 with a diagonal triangle as labeled in the daily chart, hence upside bias is seen for further gain. Recent rally above indicated retracement level at 116.69 (50% Fibonacci retracement of the intermediate fall from 139.26-94.12) adds credence to this view and signal major reversal has commenced but first leg of this wave C has possibly ended at 149.79, hence wave 2 has commenced with wave A ended at 126.09, followed by wave B at 141.06, wave C commenced and could have ended at 109.49, indicated upside targets at 126.00 and 130.00 had been met and further gain to 135.00 would follow.
On the upside, whilst recovery to 132.50-60 cannot be ruled out, previous support at 132.85 should turn into resistance and limit euro’s upside, bring another decline later. A daily close above this level would prolong consolidation and bring another rebound to 133.40-50 but said resistance at 133.89 (this week’s high) should remain intact. Only a break above this level would revive bullishness and bring test of 134.38-50 resistance area, once this barrier is penetrated, this would confirm medium term upmove has resumed and extend gain to 135.00, and then 135.50-60.
Recommendation: Stand aside for this week.
To re-cap the corrective upmove from the record low of 88.93 (18 Oct 2000), the wave A from there is subdivided as: 1:88.93-113.72, 2:99.88 (1 Jun 2001), 3:140.91 (30 May 2003), 4:124.17 (10 Nov 2003) and 5 ended at record high of 169.97 (21 Jul 2008). The brief but sharp selloff to 112.08 is viewed as a-b-c x a-b-c wave (A) of B. The subsequent rebound to 139.26 is (B) of B and (C) of (B) has possibly ended at 94.12 and in any case price should stay well above previous chart support at 88.93, bring rally in larger degree wave C towards 150.00.