GBP/JPY – 140.17
GBP/JPY – Wave 5 as well as wave (III) has possibly ended at 116.85
Although sterling fell marginally to 138.60, as the British pound has rebounded after holding above previous support at 138.45, suggesting further consolidation above this level would be seen with mild upside bias for another bounce to 140.70-75 and 141.75-80 but reckon 142.00-10 would hold from here. A daily close above resistance at 142.80 would signal the pullback from 144.75 has ended, bring further gain to 143.40-45 and then test of 144.10-15 but said resistance at 144.75 should hold. Looking ahead, a rise above 144.75 would signal the rebound from 136.50 is still in progress and may bring further upmove to indicated resistance at 145.40, break there would add credence to our bullish scenario that correction from 148.45 has ended at 136.50, bring further gain to 146.40-50, then 147.10-20.
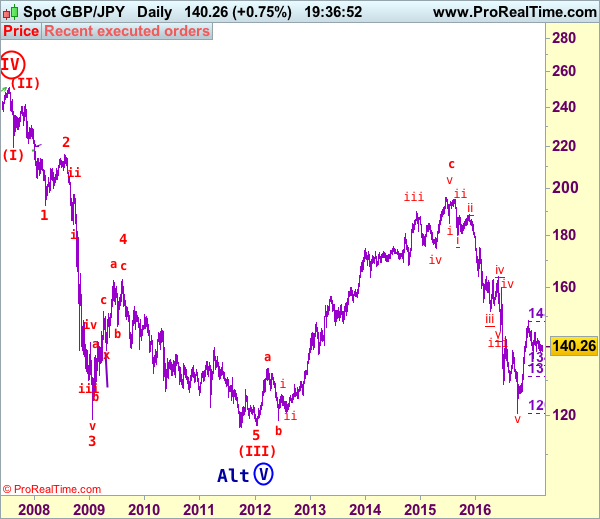
Our preferred count is that larger degree wave V with circle is unfolding from 251.12 with wave (I) 219.34, (II): 241.38 and wave (III) is subdivided into 1: 192.60, 2: 215.89 (23 Jul 2008) and wave 3 ended at 118.87 earlier in 2009. The correction from there to 162.60 is wave 4 which itself is a double three and is labeled as first a-b-c ended at 151.53, followed by wave x at 139.03, 2nd a ended at 162.60, 2nd b at 146.75 and 2nd c leg of wave 4 ended at 163.00. Therefore, the decline from 163.00 to 116.85 is now treated as wave 5 which also marked the end of larger degree wave (III), hence wave (IV) major correction has commenced for retracement of the wave (III) from 241.38 and upside target at 183.95-00 (50% Fibonacci retracement of the wave (II) from 241.38) had been met, a drop below 160.00 would suggest wave (IV) has ended at 195.85, bring decline in wave (V) for initial weakness to 130 (already met) and 120.
On the downside, expect pullback to be limited to 139.50-60 and bring another rebound. Only below said support at 138.45 would suggest a possible downside break of recent established range, bring further fall to 137.50-60 and later 137.00-05, however, reckon previous support at 136.50 would contain downside, bring another rebound later. Looking ahead, only below this level would signal another leg of decline from 148.45 top is underway for retracement of early upmove from 120.50 to 135.90-00, then towards 134.45-50 (50% Fibonacci retracement of 120.50-148.45) which is likely to hold from here.
Recommendation: Buy at 139.50 for 142.50 with stop below 138.50.
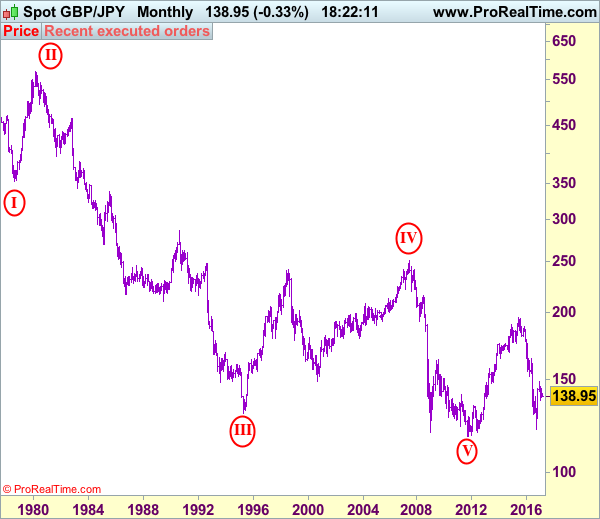
The long-term downtrend from 570.99 (29 Feb 1980) is labeled as an impulsive wave with III with circle ended at 129.77 (20 Apr 1995) and the corrective rebound to 251.12 (20 Jul 2007) is treated as wave IV with circle and the wave V with circle selloff from 251.12 has possibly ended at 116.80 (almost reached our indicated target at 116.00) and major correction has commenced from there and indicated upside target at 183.90-00 (50% Fibonacci retracement of 251.10-116.85) had been met, reckon upside would be limited to 199.80-90 (61.8% Fibonacci retracement) and bring wave (V) decline in later part of 2017.