AUD/USD – 0.7857
Although aussie staged a strong rebound last week to 0.8103 (we recommended to sell at 0.8070 and a short position was entered), renewed selling interest did emerge there and the pair has slipped again in line with our bearish expectation, retaining our view that top has been formed at 0.8125 earlier and our indicated downside target at 0.7870 was met (with 200 points profit) as price fell to as low as 0.7836 today, this anticipated decline adds credence to our view that top has been formed at 0.8125 and mild downside bias remains for this fall from there to bring retracement of recent rise to 0.7808, break there would extend weakness to 0.7740-50 and possibly towards previous resistance at 0.7712 but reckon downside would be limited to 0.7640-50, bring rebound later.
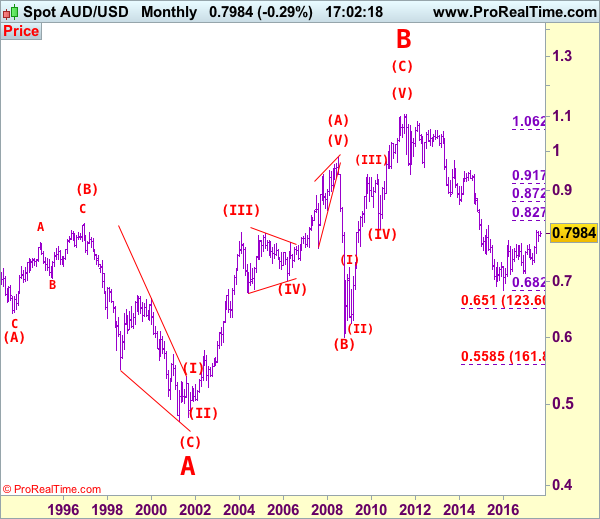
We are keeping our count that top has been formed at 1.1081 (wave 5 of V) and major correction (A-B-C-X-A-B-C) has commenced, indicated downside targets at 0.7945 (61.8% Fibonacci retracement of entire rise from 0.6007-1.1081) and 0.7750 had been met and downside bias is seen for further weakness to 0.6800, then 0.6700 but reckon 0.6500 would hold from here.
Our preferred count is that the rally from 0.6007 to 0.7270 (7 Jan 2009) is marked as wave A, the retreat to 0.6248 (2 Feb 2009) is wave B and the subsequent upmove is labeled as wave C with wave (iii) and wave (iv) ended at 0.8265 and 0.7700 respectively and wave (v) as well as 3 ended at 0.9407, then wave 4 ended at 0.8066 (instead of 0.8578). The wave 5 has met our indicated projection target of 1.1060 and could ended at 1.1081, this level is now treated as the peak of wave (C) as well as larger degree wave B, hence major fall in wave C has commenced, our initial downside target at psychological support at 0.7000 has just been met and further weakness to 0.6500 would be seen later.
On the upside, whilst initial recovery to 0.7900 cannot be ruled out, reckon upside would be limited to 0.7930-40 and bring another decline later to aforesaid downside targets. Above 0.8020 would defer and suggest first leg of decline from 0.8125 top has ended instead, risk a stronger rebound to 0.8080 but said resistance at 0.8103 should hold. Only a break of this last week’s high would signal correction from 0.8125 has ended, bring retest of this level, break there would extend recent upmove to previous resistance at 0.8163, then 0.8200 but 0.8260-65 (61.8% projection of 0.7329-0.8066 measuring from 0.7808) should hold.
Recommendation: Short entered at 0.8070 met target at 0.7870 with 200 points profit and would sell again at 0.7925 for 0.7725 with stop above 0.8025.
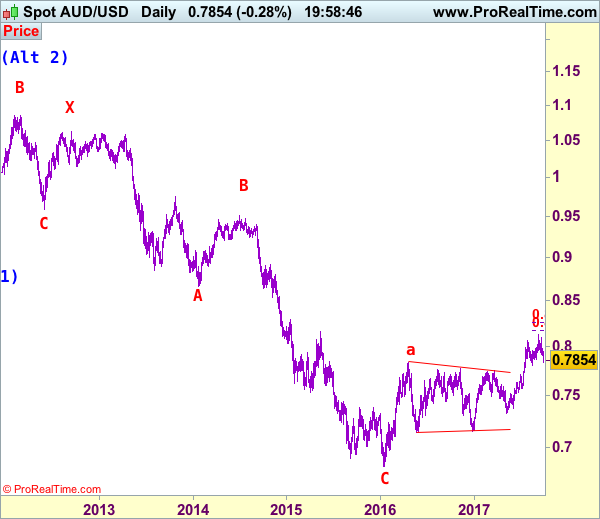
Our alternate count on the daily chart treated the top formed in 2008 at 0.9851 could be a larger degree wave I and was followed by a deep and sharp correction in wave II to 0.6007 and wave III is unfolding from there.
The long-term uptrend started from 0.4775 (2 Apr 2001) with an impulsive structure. Wave I is labeled as 0.4775 to 0.9851 (15 Jul 2008), wave II has ended at 0.6007 (Oct 2008) and wave III is still in progress which may extend further gain to 1.1265.