EUR/CHF : 1.1527
The single currency only retreated to 1.1345 (we recommended in our previous update to buy at 1.1330 and just missed our long entry) before finding renewed buying interest, the subsequent anticipated rally together with the breach of previous resistance at 1.1538 (wave iii top) add credence to our bullish view that medium term upmove has resumed and upside bias remains for further gain in wave v to 1.1600, then towards 1.1695-00 (61.8% projection of 1.0833-1.1538 measuring from 1.1259), however, this wave v is likely to be limited to1.1800 and price should falter well below 1.2000, bring correction later.
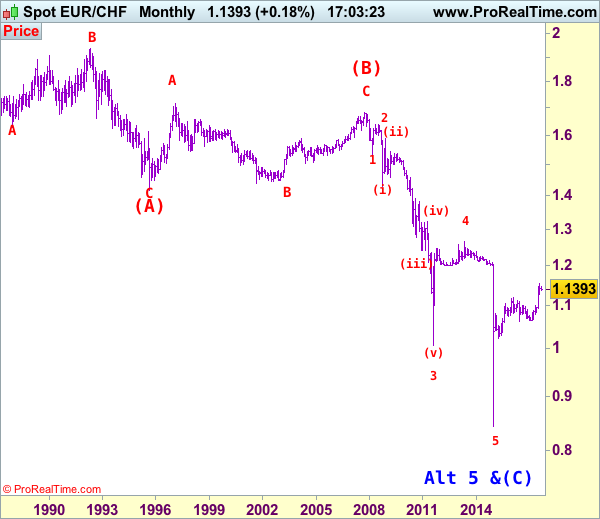
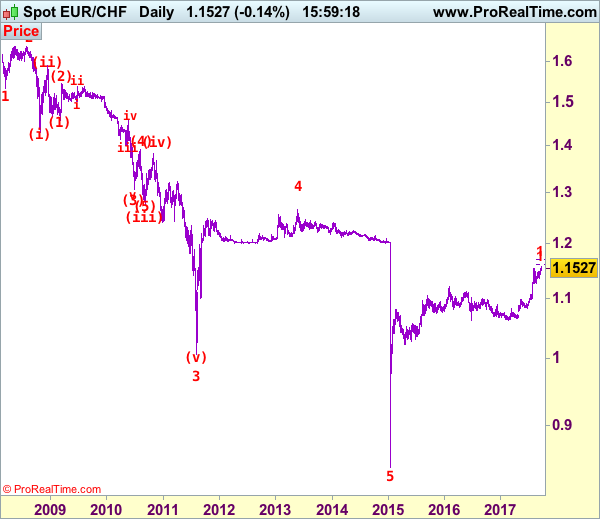
To recap our preferred count, the decline from 1.6828 (end wave (B)) is labeled as the beginning of wave (C) which should unfold as an impulsive move with 1: 1.5326, 2: 1.6377 and wave 3 is sub-divided into (i): 1.4300, (ii): 1.5880 and wave (iii) is still unfolding with (1): 1.4577, (2): 1.5448 and wave (3) is an extended 3rd with i: 1.5006, ii: 1.5383, wave iii: 1.3073, then wave iv ended at 1.3925 and wave v at 1.3073, wave (4) ended at 1.3925 and wave (5) has ended at 1.2765 which also marked the low of wave (iii) and wave (iv) has ended at 1.3835 and wave (v) as well as larger degree wave 3 has ended at 1.0075. The selloff from 1.2650 signals wave 4 has ended there and we are taking a view that the wave 5 could also have ended 0.8426, hence consolidation is seen with mild upside bias for rebound to 1.1400 (already met), then towards 1.1600.
On the downside, whilst initial pullback to 1.1490-00 is likely, reckon 1.1450 would limit downside and bring another rise later. Only a drop below said support at 1.1345 would abort and suggest top is possibly formed, bring subsequent weakness towards another previous support at 1.1259, a daily close below this level would indicate wave v has ended instead, bring major correction to 1.1200, then 1.1150-55.
Recommendation: Buy at 1.1455 for 1.1655 with stop below 1.1355.
The long-term downtrend started from 1.9626 (Apr 1985) to 1.4166 (Sep 1995) is treated as wave (A) with A:1.6285 (Dec 1987), B: 1.9342 (May 1992) and C: 1.4166, then wave (B) ended at 1.6828 with A: 1.7147 (Feb 1997), B: 1.4398 (Sep 2001), C: 1.6828 (Nov 2007), therefore, wave (C) is now in progress with the breakdown indicated as above. This wave (C) already met indicated downside target at 1.1455/60 and 1.1300, it could have ended at 0.8426, consolidation with mild upside bias is seen for gain to 1.1000 and later towards 1.2000.