USD/CHF – 1.0072
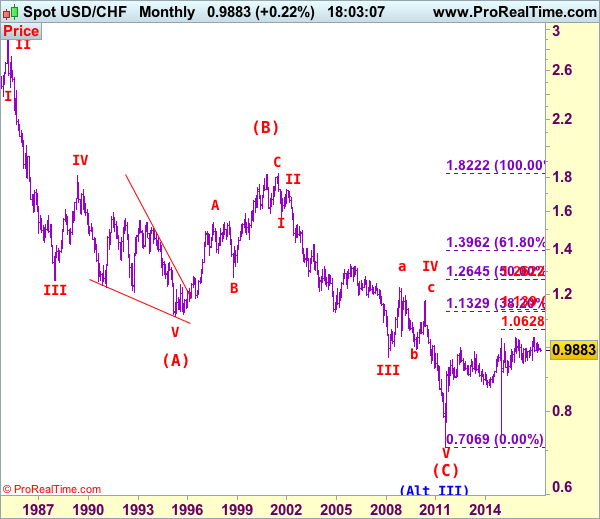
USD/CHF – Wave IV ended at 1.1730 and wave V has possibly ended at 0.7068
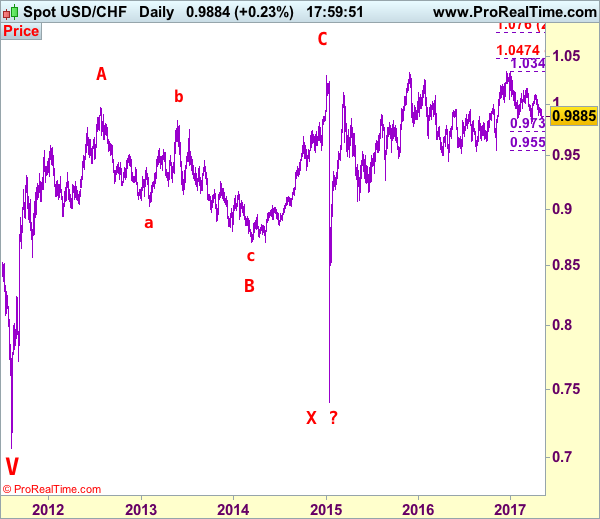
Although the greenback fell to as low as 0.9589 late last week, dollar found decent demand there and has staged a strong rebound in line with our bullish expectations, retaining our upside bias and bullishness remains for a test of resistance at 1.0108, however, break there is needed to signal the rise from 0.9813 low has resumed and extend gain to previous resistance at 1.0171. Looking ahead, once this level is penetrated, this would signal the retreat from 1.0344 has ended, bring further gain to 1.0200-10, then test of resistance at 1.0248 resistance, only above there would add credence to this view and bring resumption of early upmove for an eventual retest of 1.0344.
Our preferred count on the daily chart is that early selloff to 0.9630 is an end of the larger degree wave III and major correction is unfolding from there with a leg ended at 1.2298 (Nov 2008 with (a): 1.0625, (b):1.0011 and (c):1.2298), wave b ended at 0.9910 with (a): 1.0370, (b): 1.1967, (c): 0.9910. The rise from there to 1.1730 is the wave c which also marked the end of wave IV and wave V has possibly ended at 0.7068.
On the downside, whilst pullback to 1.0050 cannot be ruled out, reckon 1.0000 would hold and bring another rise later. Only below 0.9903 (previous resistance) would abort and prolong choppy trading, risk weakness towards said support at 0.9859 but price should stay well above previous support at 0.9813. Only below said support at 0.9813 would abort and confirm another leg of major fall from 1.0344 top is underway for further fall to 0.9735-40, however, oversold condition should prevent sharp fall below 0.9675-80 and price should stay well above 0.9600, bring rebound later.
Recommendation: Hold long entered at 0.9905 for 1.0105 with stop now at break-even
Dollar’s long-term downtrend started from 2.9343 (Feb 1995) and it was unfolding as a (A)-(B)-(C) with (A): 1.1100, (B): 1.8310 (26 Oct 2000), then followed by another impulsive wave (C) with wave III ended at 0.9630 (Mar 2008). Under this count, correction in wave IV has possibly ended at 1.1730 and wave V already broke below support at 0.9630 and met indicated downside target at 0.7500 and 0.7400. The reversal from 0.7068 suggests the wave V has possibly ended and the breach of resistance at 0.9595 add credence to this view and indicated upside target at 1.0000 had been met, however, the sharp retreat from 1.0296 to 0.7401 suggests choppy trading would be seen but price should stay above said record low at 0.7068.