EUR/CAD – 1.4693
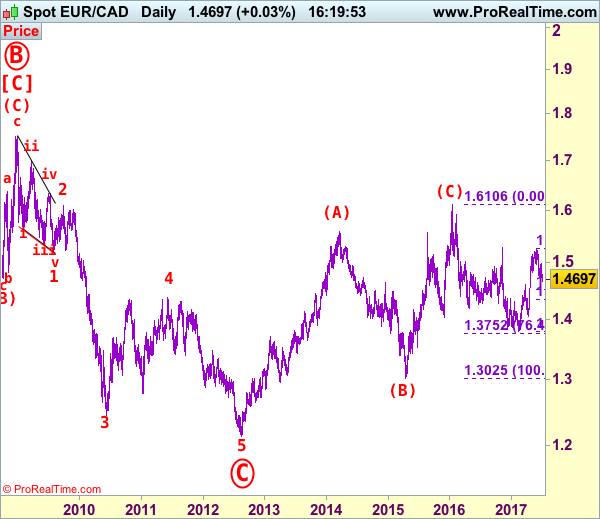
EUR/CAD: Wave 4 ended at 1.4380 and wave 5 as well as circle wave C has possibly ended at 1.2129, major (A)-(B)-(C) correction has commenced and indicated target at 1.6000 had been met.
The single currency only recovered to 1.4980 (we recommended to sell at 1.5000 in our previous update and missed the entry) before dropping again, adding credence to our view that top has been formed at 1.5259 last month, hence downside bias remains for this fall from there to extend weakness to 1.4600, then 1.4520-25 (50% Fibonacci retracement of entire rise from 1.3784-1.5259), however, near term oversold condition should limit downside to 1.4480-85 and reckon support at 1.4397 would hold from here, risk from there is seen for a strong rebound to take place later.
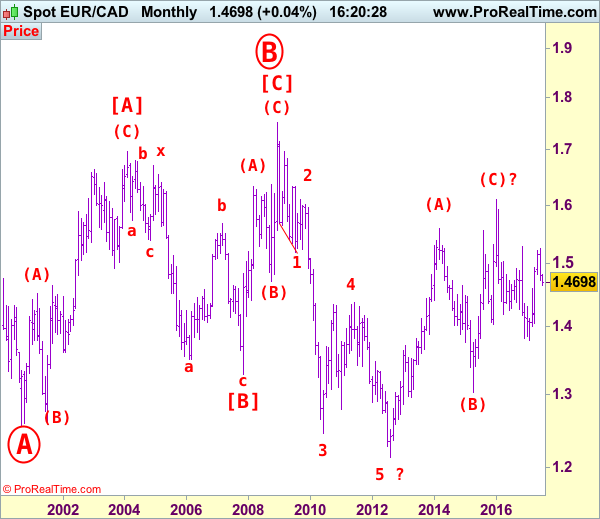
Our latest preferred count is that larger degree wave [C] from 1.3289 as well as circle wave B ended at 1.7509 in Dec 2008 with (A): 1.6325, (B): 1.4719 followed by wave (C) at 1.7509, hence circle wave C is unfolding with wave 1 ended at 1.5186 (diagonal wave 1), wave 2 at 1.6096, impulsive wave 3 has ended at 1.2451, followed by wave 4 at 1.4380, in view of recent strong rebound, we are now treating the wave 5 as well as larger degree circle wave C has ended at 1.2129, hence (A)-(B)-(C) correction has commenced from there with impulsive wave (C) now unfolding and indicated initial upside target at 1.6000 had been met and reckon 1.6500 would hold.
On the upside, whilst initial recovery to 1.4730-35 and possibly 1.4780 cannot be ruled out, reckon upside would be limited to 1.4830-35 and bring another decline later. Above 1.4900 would risk another test of said resistance at 1.4980, break there would signal first leg of decline from 1.5259 top has ended, risk a stronger rebound to 1.5050 and possibly towards 1.5100-10 but price should alter well below said resistance at 1.5259 and bring another decline later this month.
Recommendation: Sell at 1.4770 for 1.4570 with stop above 1.4870.
On the bigger picture, our long-term count on the monthly chart is that a big sideways consolidation from 2000 low of 1.2557 has possibly ended at 1.7509 as circle wave B with [A]: 1.6976 ( (A): 1.4513, (B): 1.2612, (C): 1.6976), wave [B]: 1.3289 is a double three with 1st a-b-c: 1.5384, x: 1.6709 and 2nd a-b-c: 1.3289. As indicated above, the wave [C] has ended at 1.7509. The selloff from there is now unfolding which itself should be labeled as an impulsive wave with wave 1: 1.5186 (diagonal wave 1), followed by wave 2: 1.6096 and wave 3: 1.2451, wave 4: 1.4380, wave 5 as well as larger degree circle wave C has possibly ended at 1.2129 and major correction has possibly commenced for retracement of recent decline towards 1.4000, then 1.4180-90 (38.2% Fibonacci retracement of 1.7509-1.2129). Below said support at 1.2129 would risk weakness to psychological support at 1.2000 and then 1.1851 (50% projection of 1.7509-1.2451 measuring from 1.4380) but reckon 1.1500 would remain intact, bring reversal later.