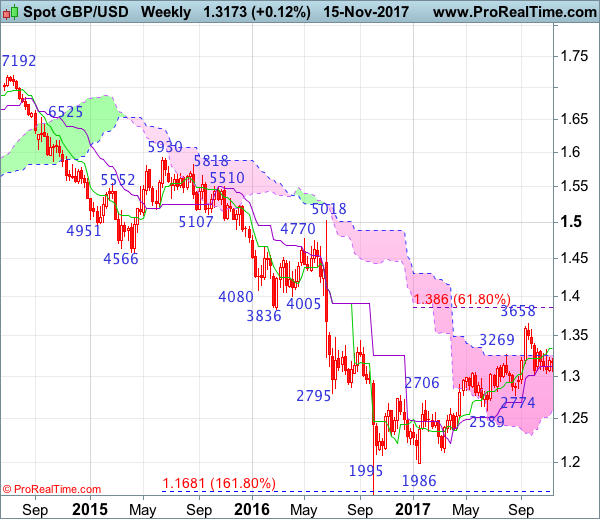
Weekly
• Last Candlesticks pattern: Shooting star
• Time of formation: 31 Jul 2017
• Trend bias: Down
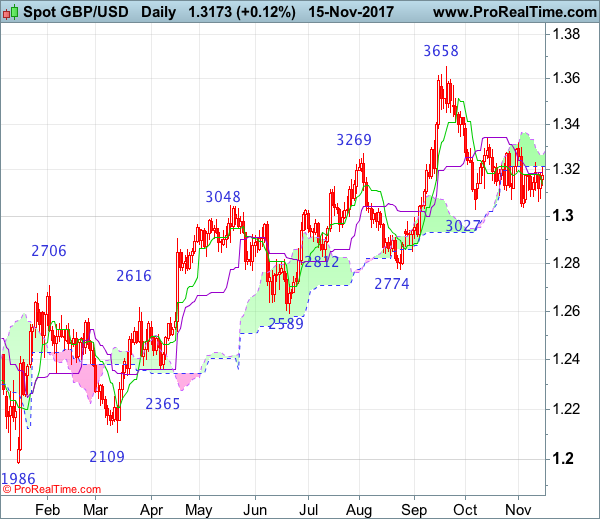
Daily
• Last Candlesticks pattern: Morning star
• Time of formation: 25 Aug 2017
• Trend bias: Near term up
GBP/USD – 1.3144
The British pound has remained confined within recent established range and further choppy trading is in store, although another corrective bounce to 1.3220-30 cannot be ruled out, outlook remains consolidative, reckon upside would be limited to 1.3285-90 and previous resistance at 1.3338 should hold from here, bring retreat later. Only a break of indicated previous resistance at 1.3338 would shift risk to the upside and signal another leg of rebound from 1.3027 is underway for gain to 1.3400, then test of previous resistance at 1.3455 which is likely to hold on first testing.
On the downside, whilst pullback to 1.3085-90 cannot be ruled out, reckon support at 1.3062 (this week’s low) would limit downside and indicated strong support area at 1.3027-39 should remain intact. In the event sterling is able to penetrate 1.3027-39 support area, this would shift risk back to downside and confirm the fall from 1.3658 top has resumed for further weakness to 1.3000, then towards 1.2940-50 later but minor support at 1.2852 would contain downside.
Recommendation: Stand aside for this week.
On the weekly chart, sterling continued trading inside familiar range in part due to cross-trading, hence further consolidation within 1.3062-1.3338 would take place and although recovery to 1.3230 cannot be ruled out, reckon said upper range would put a lid on cable and bring retreat later. A break above 1.3338 would suggest the retreat from 1.3658 has ended instead, bring a stronger rebound to 1.3400-05 and possibly towards 1.3490-00 but price should falter well below said resistance at 1.3658. In the event sterling breaks above 1.3571 resistance, this would bring a retest of this last month’s high at 1.3658, break there would extend recent erratic rise from 1.1986 low to 1.3750-60 and 1.3800 but overbought condition should prevent sharp move beyond 1.3860 (61.8% Fibonacci retracement of 1.5018-1.1986).
On the downside, expect pullback to be limited to 1.3075-85 and bring another rebound. Only a drop below indicated support area at 1.3027-39 would revive near term bearishness and signal a temporary top has been formed at 1.3658 earlier, bring retracement of recent rise to 1.3000, then towards support at 1.2909 but anticipated near term oversold condition should prevent sharp fall below previous chart support at 1.2774 and price should stay well above another previous chart support at 1.2589, bring rebound later.