Weekly
• Last Candlesticks pattern: Shooting star
• Time of formation: 7 Mar 2017
• Trend bias: Sideways
Daily
• Last Candlesticks pattern: Morning star
• Time of formation: 9 May 2017
• Trend bias: Near term up
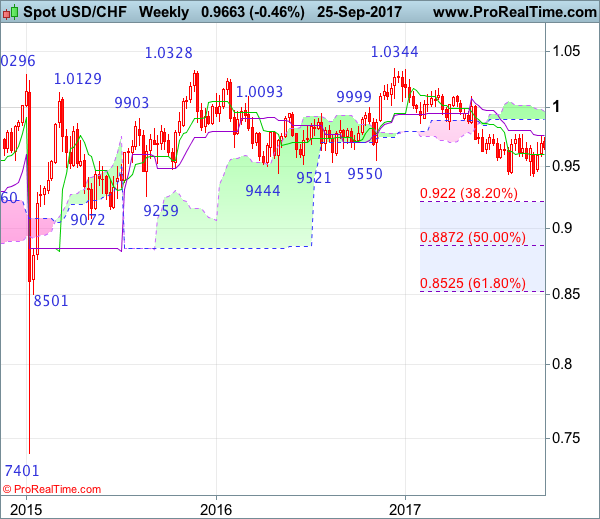
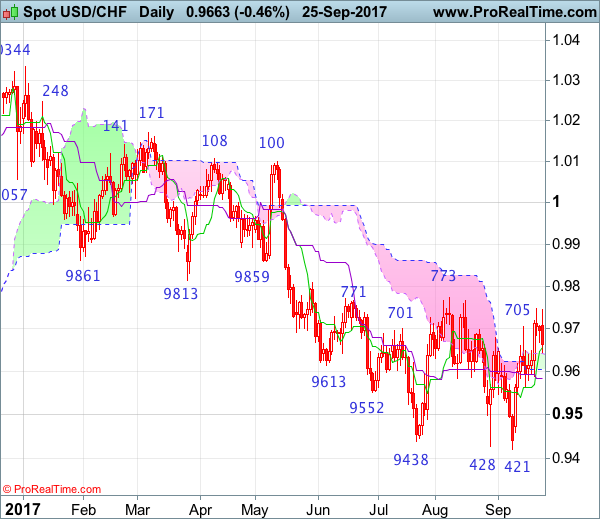
USD/CHF – 0.9690
Although the greenback found support at 0.9565 and surged again last week, lack of follow through buying and the subsequent retreat from 0.9748 (last week’s high) suggest consolidation below this level would be seen and pullback to the Tenkan-Sen (now at 0.9657), then 0.9600-10 is likely, however, break of said support at 0.9565 is needed to revive our bearishness and signal top is formed, bring weakness to 0.9520-25 and 0.9500. Looking ahead, dollar needs to penetrate 0.9455-60 to signal the rebound from 0.9421 has ended, bring retest of this level, break there would confirm recent decline from 1.0344 (2016 top) has resumed and extend weakness to 0.9390-00, then towards 0.9330-35.
On the upside, expect recovery to be limited to 0.9715-20 and said resistance at 0.9748 should hold. Only a break of this last week’s high would signal the rise from 0.9421 low is still in progress for at least a retracement of early decline to 0.9765-73 (50% Fibonacci retracement of 1.0108-0.9421 and previous resistance), having said that, dollar needs to penetrate this level to signal the decline from 1.0344 has ended, bring further subsequent gain to 0.9845-50 (61.8% Fibonacci retracement of 1.0108-0.9421), however, reckon upside would be limited to 0.9900-10 and price should falter well below psychological resistance at 1.0000.
Recommendation: Stand aside for this week.
On the weekly chart, although the greenback edged higher last week, dollar continued meeting resistance just below the Kijun-Sen (now at 0.9765), price needs to penetrate previous resistance at 0.9773 to retain near term bullishness and add credence to our view that low has been formed at 0.9421, bring retracement of recent decline to 0.9845-50 (61.8% Fibonacci retracement of 1.0108-0.9421), then test of the lower Kumo (now at 0.9894) but upside should be limited to the upper Kumo (now at 0.9970), price should falter well below resistance at 1.0100-08.
On the downside, whilst initial pullback to the Tenkan-Sen (now at 0.9597) cannot be ruled out, reckon last week’s low at 0.9580 would hold and bring another rebound. Only below 0.9565 support would signal the rebound from 0.9421 has ended, bring further fall to 0.9500 but break of 0.9455-60 is needed to retain bearishness and bring retest of this level, break there would extend recent decline from 1.0344 top to 0.9350, then towards previous support at 0.9259, however, oversold condition should prevent sharp fall below 0.9220 (38.2% Fibonacci retracement of 0.7401-1.0344) and reckon 0.9150 would hold from here, risk from there is seen for a rebound later.