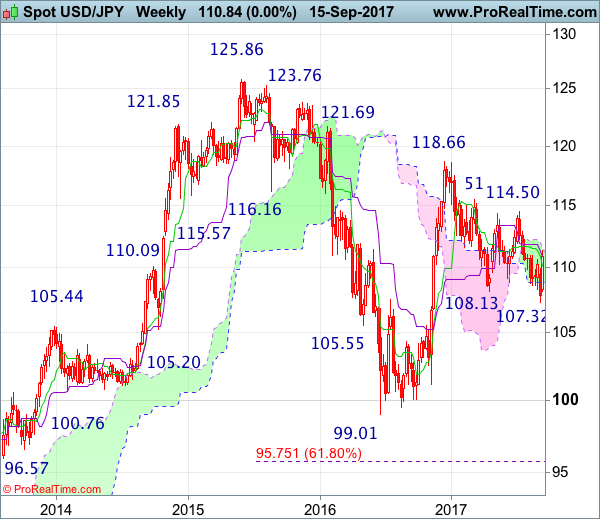
Weekly
• Last Candlesticks pattern: Dark cloud cover
• Time of formation: 10 Jul 2017
• Trend bias: Down
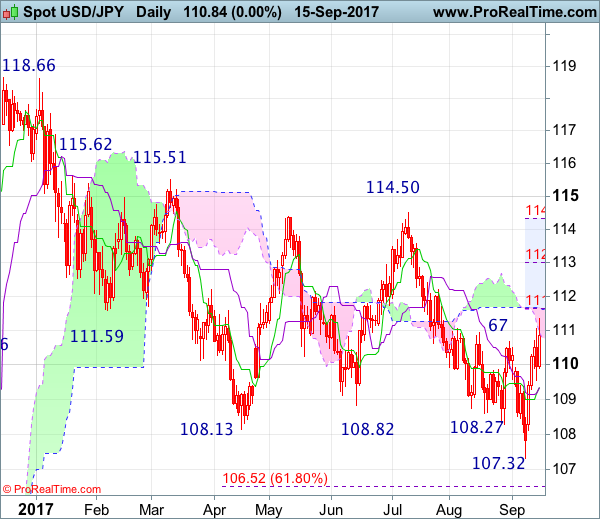
Daily
• Last Candlesticks pattern: Evening doji
• Time of formation: 7 Aug 2017
• Trend bias: Down
USD/JPY – 111.30
Despite falling to 107.32, the subsequent much stronger-than-expected rebound suggests a temporary low has been formed there and consolidation with upside bias is seen for test of 111.62-65 (current level of the upper Kumo and 38.2% Fibonacci retracement of 118.66-107.32), then towards previous resistance at 112.20, however, a sustained breach above there is needed to add credence to this view, bring retracement of recent entire decline from 118.66 to 112.99-00 (50% Fibonacci retracement) but reckon upside would be limited to 113.50-60, price should falter below 114.00.
On the downside, whilst pullback to 110.45-50 cannot be ruled out, reckon support at 109.90 would limit downside and bring another rise later. Below support at 109.55 would abort and suggest the rebound from 107.32 has ended instead, bring weakness to 109.00, however, still reckon downside would be limited to 108.45-50 and this week’s low at 108.12 should remain intact, price should stay well above recent low at 107.32, brig another rebound later.
Recommendation : Buy at 110.00 for 112.00 with stop below 109.00
On the weekly chart, the greenback opened higher last week and staged a stronger-than-expected rebound, a long white candlestick was formed, suggesting a temporary low has been made at 107.32, hence consolidation with mild upside bias is seen for gain to 112.20 resistance, however, above 112.99-00 (50% Fibonacci retracement of 118.66-107.32) is needed to signal recent entire decline from 118.66 has ended, bring further rise to 113.50-60, then towards 114.00 but price should falter well below chart resistance at 114.50 (July high) and bring retreat later.
On the downside, although initial pullback to 110.40-50 is likely, reckon the Tenkan-Sen (now at 109.76) would limit downside and the lower Kumo (now at 108.84) should hold, bring another rebound later. A drop below last week’s low at 108.12 would abort and suggest the rebound from 107.32 hs ended instead, bring retest of this level. Looking ahead, only a drop below 107.32 would signal the decline from 118.66 top has resume,ed and extend weakness to 107.00, then 106.50-55 (61.8% Fibonacci retracement of 99.01-118.66), however, previous resistance at 105.53 (now support) should remain intact.