Weekly
• Last Candlesticks pattern: Long white candlestick
• Time of formation: 24 Jul 2017
• Trend bias: Up
Daily
• Last Candlesticks pattern: Morning doji
• Time of formation: 25 Jul 2017
• Trend bias: Up
EUR/CHF – 1.1408
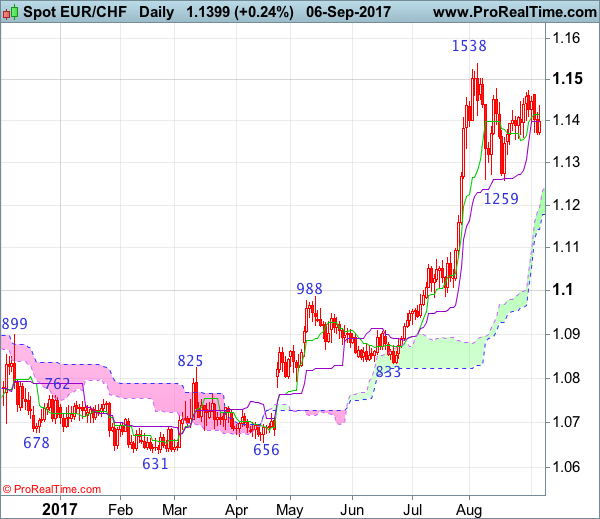
Although the single currency has retreated after rising to 1.1473 last week and further consolidation is in store, as long as indicated support at 1.1355 holds, bullishness remains for another rebound, above resistance at 1.1473-79 would add credence to our view that pullback from 1.1538 has ended at 1.1259 and bring further gain to 1.1500, then retest of 1.1538. Having said that, only a break of this recent high would confirm recent upmove has resumed and extend headway to 1.1600-10 but further sharp move beyond 1.1700 should not be repeated and price should falter below 1.1770-80, bring retreat later.
On the downside, as long as said support at 1.1355-56 holds, bullishness remains for another rise later. Below said support would defer and risk test of 1.1320-25, break there would suggest the rebound from 1.1259 has ended instead, bring retest of this level, below there would extend the corrective fall from 1.1538 top for retracement of recent upmove to 1.1185 (50% Fibonacci retracement of 1.0833-1.1538), however, sharp fall below 1.1100-05 (61.8% Fibonacci retracement) should not be repeated and 1.1050 would hold, bring rebound later.
Recommendation: Hold long entered at 1.1355 for 1.1555 with stop below 1.1350.
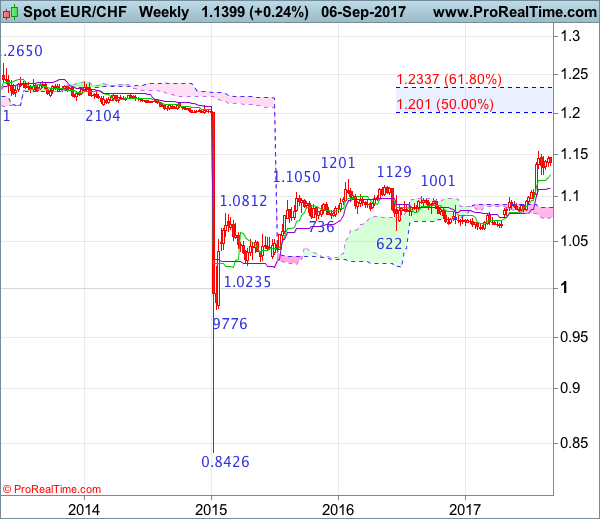
On the weekly chart, despite last week’s rebound to 1.1473, as the single currency has retreated after failing to penetrate indicated resistance at 1.1479, suggesting further sideways trading would take place, however, still reckon downside would be limited to support at 1.1355-59 and bring another rebound, a firm break above said resistance at 1.1473-79 would signal the pullback from 1.1538 has ended at 1.1259 and bring retest of this level. Only a break of this recent high would revive bullishness and extend the major rise from 0.8426 low for headway to 1.1590-00, then towards 1.1700-10 but overbought condition should prevent sharp move beyond 1.1800 and reckon 1.1900-10 would hold from here, risk from there has increased for a retreat to take place later.
On the downside, expect pullback to be limited to 1.1355-59 and bring another rise later. Below 1.1320-25 would risk test of 1.1259-61 (said support and current level of the Tenkan-Sen), a weekly close below there would shift near term risk to the downside and suggest a temporary top is formed instead, bring retracement of recent rise to 1.1100-05 (61.8% Fibonacci retracement of 1.0833-1.1538), then test of the Kijun-Sen (now at 1.1087) but reckon support at 1.0987 would remain intact.