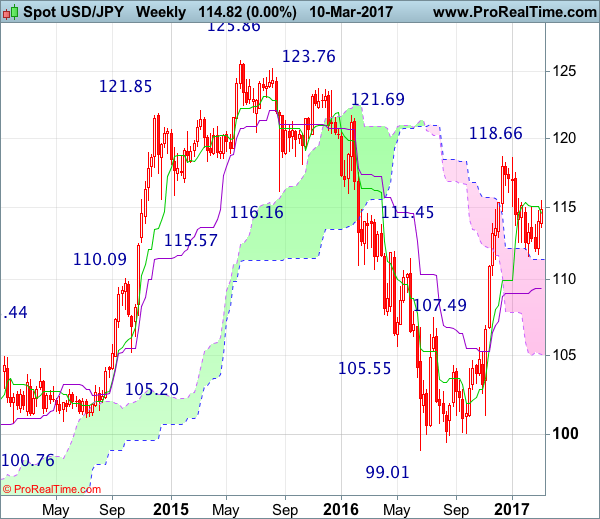
Weekly
- Last Candlesticks pattern: Hanging man
- Time of formation: 22 May 2016
- Trend bias: Down
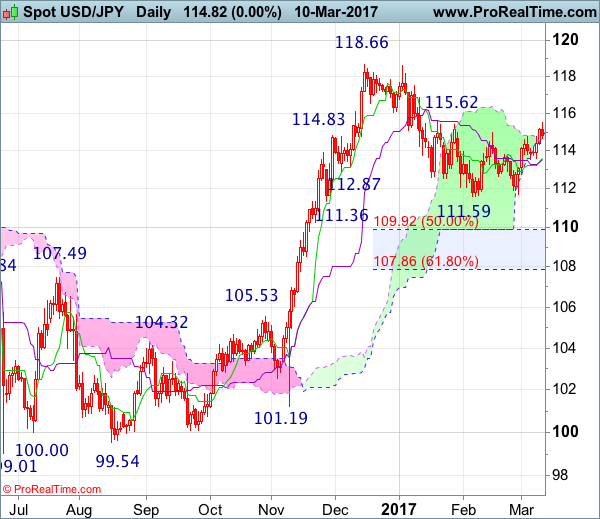
Daily
- Last Candlesticks pattern: Shooting star
- Time of formation: 15 Feb 2017
- Trend bias: Down
USD/JPY – 114.70
As dollar has retreated after rising to 115.51, suggesting consolidation below this level would be seen and pullback to 114.20-25 and then 114.00-05 (38.2% Fibonacci retracement of 111.69-115.51) is likely, however, reckon support at 113.56-61 would limit downside and bring another rise later, only break of said resistance at 115.51 would retain bullishness and signal the erratic rise from 111.59 is still in progress for further gain to 116.00, then 116.85-90 but upside should be limited to 117.50-55, bring another retreat later.
On the downside, whilst initial pullback to 114.00-05 is likely, reckon downside would be limited to 113.56-60 (previous support and 50% Fibonacci retracement of 111.69-115.51) and bring another rise later. Only below 113.15 (61,8% Fibonacci retracement) would abort and signal top is formed instead, bring further fall to 112.75-85 but downside should be limited to 112.00 and price should stay above strong support at 111.59-69.
Recommendation : Buy at 113.75 for 115.75 with stop below 112.75
On the weekly chart, dollar’s rebound after holding above previous support at 111.59 has retained our view that further consolidation above this level would be seen and mild upside bias remains for gain to 115.51-62 resistance area but a weekly close above there is needed to suggest the pullback from 118.66 top has ended at 111.59, bring further gain to 116.40-50, break there would signal early upmove has resumed for headway to 116.40-50, then test of 116.87 resistance first.
On the downside, expect pullback to be limited to 113.56-61 support (also current level of the Tenkan-Sen), bring another rebound later. Below 113.10-15 would abort and suggest the rebound from 111.69 has ended instead, risk further fall to 112.50-60, then towards 112.00 but said support at 111.59-69 should hold from here, bring another rebound. Looking ahead, only a drop below there signal the retreat from 118.66 top is still in progress for retracement of recent upmove to support at 111.36, then towards 110.90-95 (50% Fibonacci retracement of 101.19-118.66), however, reckon downside would be limited to 110.00 and the Kijun-Sen (now at 109.38) should hold, bring another rebound later.