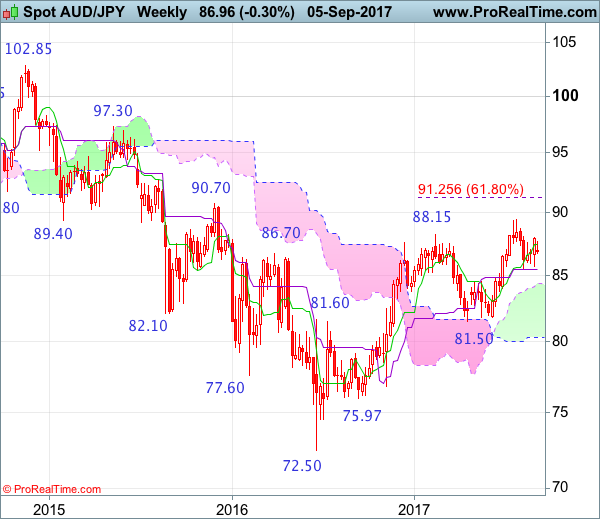
Weekly
• Last Candlesticks pattern: Shooting star
• Time of formation: 13 Mar 2017
• Trend bias: Down
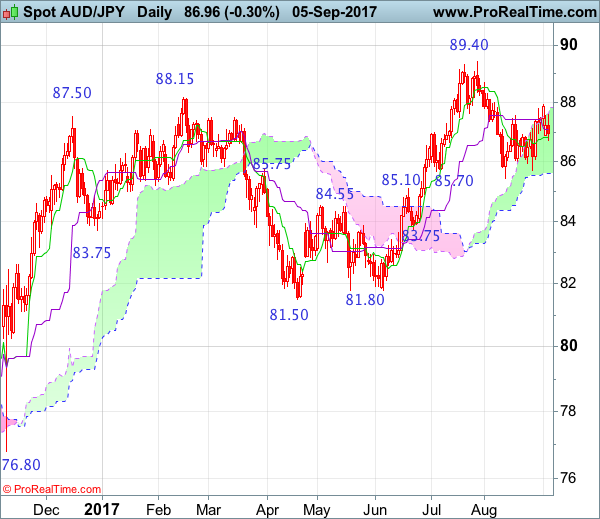
Daily
• Last Candlesticks pattern: Bearish engulfing pattern
• Time of formation: 16 Feb 2017
• Trend bias: Near term down
AUD/JPY – 86.80
Despite rising to 87.90 (just missed our upside target at 88.00), as aussie ran into heavy offers there and has retreated, dampening our bullishness and consolidation below this level would be seen, downside risk of weakness to 86.50 and possibly 86.05-10 cannot be ruled out, however, still reckon support at 85.70 (last week’s low) would hold and bring rebound later. Only a drop below 85.70 would signal the fall from 89.40 top has resumed and bring test of previous support at 85.45, break there would confirm and extend weakness bring retracement of recent rise to 85.00, then 84.50, having said that, near term oversold condition should limit downside to previous support at 83.75 and bring another rebound in late Q3.
On the upside, expect recovery to be limited to 87.20 and resistance at 87.60 should hold, bring another retreat later. Only break of said resistance at 87.90 would revive bullishness and extend the rebound from 85.45 low towards resistance at 88.70-75, however, break there is needed to signal the retreat from 89.40 has ended, bring another rise towards this level, otherwise, further choppy trading would take place. Looking ahead, only a break of this recent high would confirm medium term upmove from 2016 low of 72.50 has resumed and extend further gain to psychological resistance at 90.00, then towards previous chart resistance at 90.70.
Recommendation: Take profit on our long position entered at 85.75 and stand aside
On the weekly chart, although aussie rebounded last week to 87.90, the subsequent retreat suggests further sideways consolidation would be seen and pullback to 86.00-10 cannot be ruled out, however, reckon support at 85.45 would hold and bring another rebound later. Above 87.90-00 would bring test of indicated resistance at 88.70-75 but break there is needed to signal the retreat from 89.40 has ended, bring retest of this level which is likely to hold on first testing. Looking ahead, above this recent high would confirm medium term upmove from 72.50 low (formed back in 2016) has resumed and may extend headway to psychological resistance at 90.00, then test of previous resistance at 90.70 but overbought condition should limit upside to 91.50-60 and price should falter below another previous chart resistance at 92.70, bring correction later.
On the downside, below said support at 85.45 (same level as current Kijun-Sen) would suggest a temporary top has possibly been formed at 89.40 and downside risk remains for retracement of recent upmove to bring further fall to 84.95-00, then test of the upper Kumo (now at 84.34) but reckon previous support at 83.75 would limit downside and price should stay above support at 82.55-60, bring rebound later.