Weekly
• Last Candlesticks pattern: Shooting doji
• Time of formation: 01 May 2017
• Trend bias: Sideways
Daily
• Last Candlesticks pattern: Bearish engulfing
• Time of formation: 5 May 2017
• Trend bias: Down
USD/CAD – 1.2490
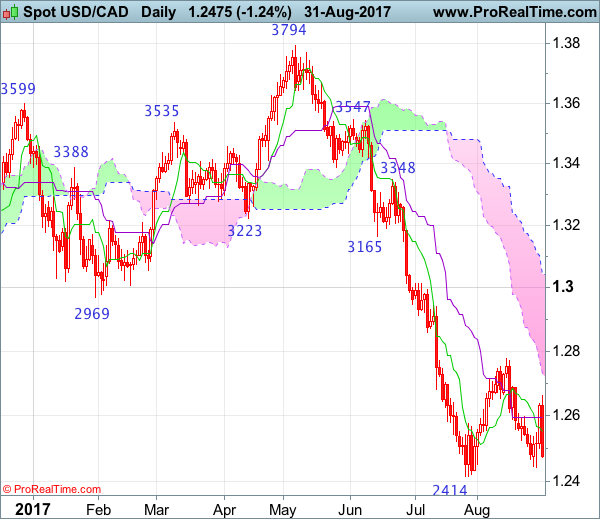
Although the greenback found support at 1.2441 earlier this week and staged a rebound, renewed selling interest emerged at 1.2663 and price has retreated again, retaining our bearishness and as long as this level holds, downside bias remains for another test of 1.2441, below there would signal recent decline has resumed for retest of 1.2414. Looking ahead, once this support is penetrated, this would confirm resumption of early downtrend to 1.2350-60 and later towards 1.2300 but price should stay well above 1.2240-50, risk from there has increased for a rebound to take place later.
On the upside, expect recovery to be limited to 1.2590-00 and bring another decline later. A break of said resistance at 1.2663 would signal recent downtrend is not ready to resume yet and further consolidation would take place, hence another corrective bounce to 1.2700-10 cannot be ruled out, break there would risk test of previous resistance at 1.2778, having said that, only break of this level would abort and bring retracement of recent decline to 1.2810-20 but price should falter below previous support at 1.2859 (now resistance) and bring another decline later. Looking ahead, only a sustained breach above this level would signal a temporary low is formed instead, bring retracement of recent decline to 1.2900-05 but price should falter well below resistance at 1.3015, bring another selloff later.
Recommendation: Hold short entered at 1.2640 for 1.2440 with stop above 1.2665.
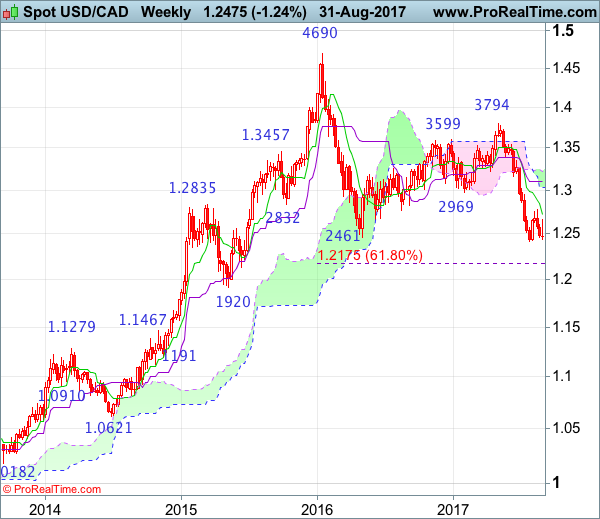
On the weekly chart, although the greenback recovered after holding above recent low at 1.2414 and further consolidation would be seen, reckon upside would be limited to 1.2660-65 and bring another decline, below 1.2441 would bring retest of 1.2414, however, break there is needed to confirm the selloff from 1.4690 top has resumed and extend weakness to 1.2300-10 but oversold condition should prevent sharp fall below 1.2240-50 and price should stay above 1.2175 (61.8% Fibonacci retracement of 1.0621-1.4690), risk from there is seen for another corrective rebound to take place later.
On the upside, whilst recovery to 1.2590-00 cannot be ruled out, said resistance at 1.2663 should hold and bring another decline later. A break of this level would prolong consolidation above 1.2414 and risk rebound towards resistance at 1.2778, above there would risk a stronger corrective bounce to 1.2805-10 resistance, then test of previous support at 1.2859 (now resistance), above there would suggest a temporary low has been formed instead, bring further gain to 1.2900, then towards resistance at 1.2944 but upside should be limited to psychological level at 1.3000 and price should falter below the Kijun-Sen (now at 1.3104), bring another selloff in late Q3.