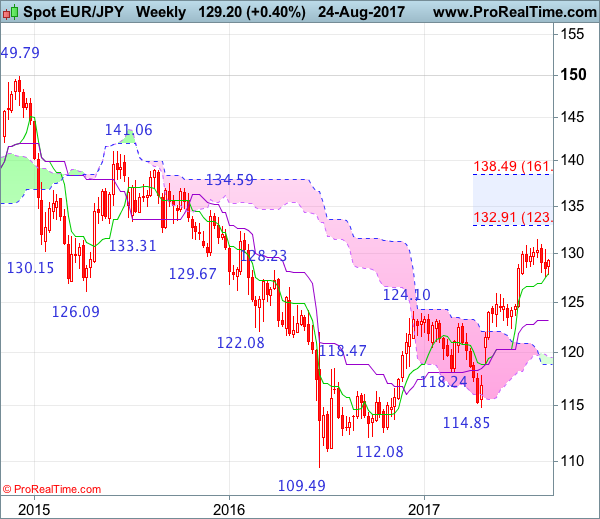
Weekly
• Last Candlesticks pattern: Window
• Time of formation: 24 April 2017
• Trend bias: Up
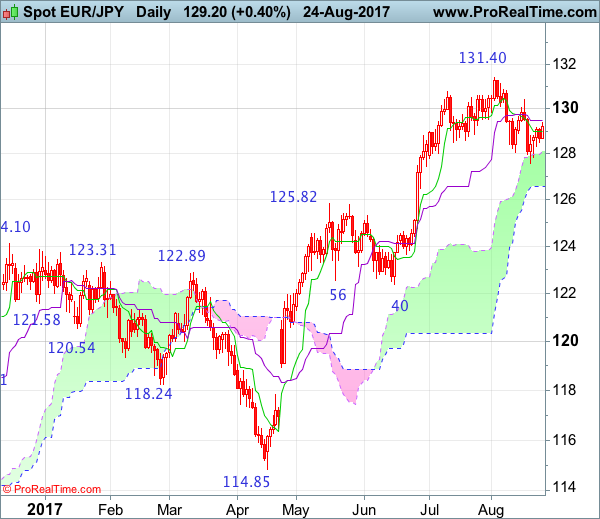
Daily
• Last Candlesticks pattern: Hammer
• Time of formation: 18 May 2017
• Trend bias: Up
EUR/JPY – 129.15
Although the single currency extended the fall from 131.40 to 127.56 late last week, the subsequent rebound suggests consolidation above said support would be seen and test of the Kijun-Sen (now at 129.48) cannot be ruled out, however, a daily close above there is needed to signal low has been formed, bring further gain to 130.00 but resistance at 130.40 should remain intact. Only a daily close above this level would signal the fall from 131.40 has ended, bring further gain to 131.00, then towards this recent high.
On the downside, below 128.30-35 would suggest the rebound from 127.56 has possibly ended, bring weakness to 127.84 but break there is needed to revive bearishness and extend the fall from 131.40 top for retest of 127.56, break there would bring further fall to 126.85-90 (50% Fibonacci retracement of 122.38-131.40), then test of the lower Kumo (now at 126.59), however, downside should be limited to 126.00-10 and reckon 125.80-85 (61.8% Fibonacci retracement) would hold from here, brig rebound later.
Recommendation: Exit short entered at 129.50 and stand aside for this week.
On the weekly chart, as the single currency has retreated after rising to 131.40 earlier, retaining our view that consolidation below this level would be seen and downside bias remains, break of support at 127.56 (last week’s low) would bring retracement of recent upmove to 126.85-90 (50% Fibonacci retracement of 122.38-131.40), then towards 126.00-10 but previous resistance at 125.81 (also 61.8% Fibonacci retracement) should turn into support and limit euro’s downside, reckon 124.50 would remain intact, bring rebound later.
On the upside, expect recovery to be limited to 129.50 and 130.00 would hold, bring another decline. Above resistance at 130.40 (last week’s high) would bring recovery to resistance at 130.83 which is likely to hold, bring another retreat later. Only break of 130.83 would bring retest of 131.40 but break there is needed to revive bullishness and extend major upmove from 109.49 low to 131.90-00, then test of previous chart resistance at 132.33, however, overbought condition should limit upside to 133.00-10, risk from there is seen for a retreat to take place later.