Weekly
- Last Candlesticks pattern: Bullish engulfing
- Time of formation: 02 May 2016
- Trend bias: Up
Daily
- Last Candlesticks pattern: Hammer
- Time of formation: 19 Oct 2016
- Trend bias: Up
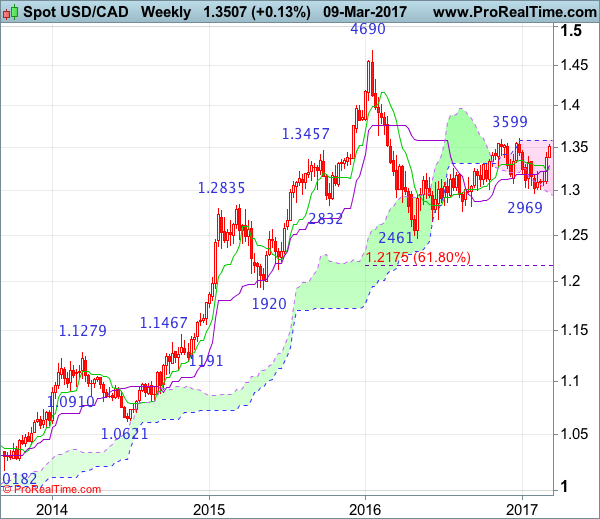
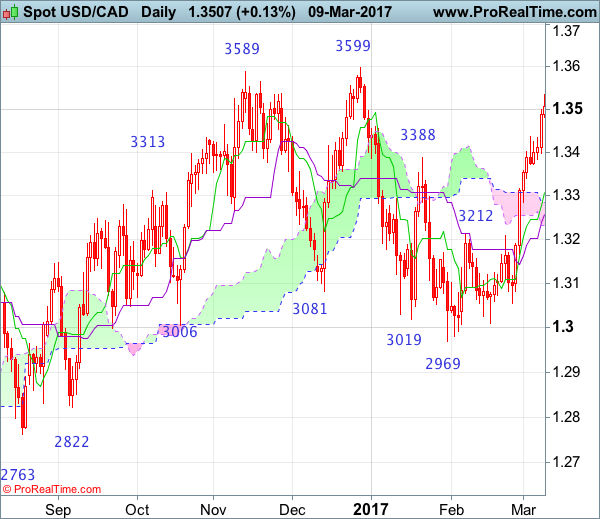
USD/CAD – 1.3505
The greenback has surged again after brief pullback, suggesting easy fall from 1.3599 top has ended at 1.2969 and mild upside bias remains for the rise from there to extend further giant 1.3550-55, however, reckon said resistance at 1.3599 would hold on first testing due to near term overbought condition. Only a break of this level would retain bullishness and extend early erratic upmove from 1.2461 low to 1.3660-70 and then 1.3700 but still reckon upside would be limited and risk from there is seen for a retreat later.
On the downside, whilst pullback to 1.3430-40 cannot be ruled out, reckon minor support at 1.3372 would limit downside and bring another rise later. Only a drop below the Tenkan-Sen (now at 1.3309) would defer and suggest top is possibly formed, bring test of the Kijun-Sen (now at 1.3258) but a daily close below there is needed to add credence to this view, bring retracement of recent rise to 1.3220-25 but downside should be limited to 1.3165 and bring rebound later.
Recommendation: Stand aside for this week.
On the weekly chart, after forming a long white candlestick last week, the greenback has continued moving higher this week and another white candlestick looks set to be formed this week, adding credence to our view that the fall from 1.3599 has ended at 1.2969 earlier, hence consolidation with mild upside bias is seen for further gain towards said resistance at 1.3599, however, a break of this resistance is needed to retain bullishness and extend the erratic rise from 1.2461 (2016 low) to 1.3700 and later towards 1.3835-40 (61.8% Fibonacci retracement of 1.4690-1.2461) which is likely to cap upside.
On the downside, although pullback to 1.3400-10 cannot be ruled out, reckon downside would be limited to 1.3372 minor support and bring another rise later. A drop below this week’s low at 1.3372 would risk test of the Kijun-Sen (now at 1.3284) but a weekly close below there Tenkan-Sen (now at 1.3252) is needed to suggest a temporary top is formed instead, risk weakness to 1.3210, break there would add credence to this view and bring further fall to 1.3150 and possibly towards 1.3083, however, indicated support at 1.3056 support should hold.