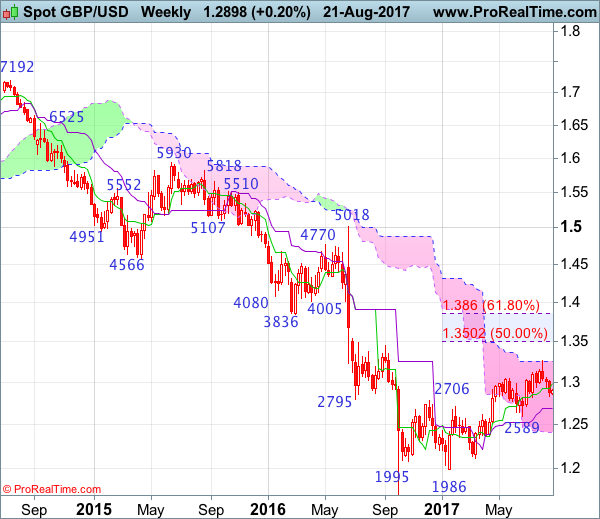
Weekly
• Last Candlesticks pattern: Long white candlestick
• Time of formation: 16 Jan 2017
• Trend bias: Down
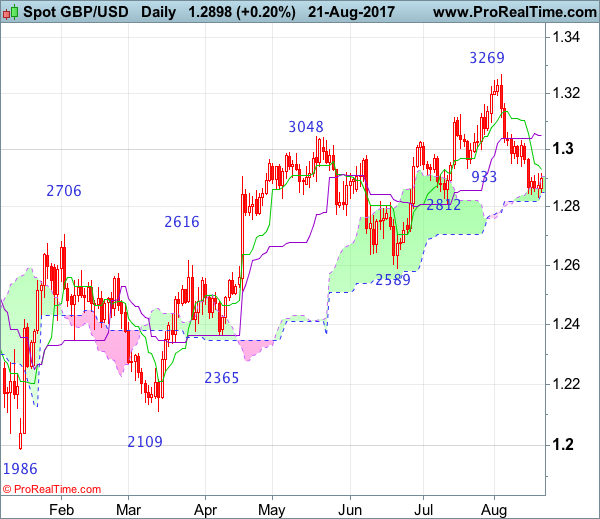
Daily
• Last Candlesticks pattern: Long white candlestick
• Time of formation: 18 Apr 2017
• Trend bias: Near term up
GBP/USD – 1.2857
Cable has remained under pressure after recent selloff below indicated support at 1.2933, adding credence to our view that a temporary top has been formed earlier at 1.3269 and further consolidation below this level would take place with mild downside bias for at least a strong retracement of recent upmove to support at 1.2812, then 1.2775-80 (38.2% Fibonacci retracement of 1.1986-1.3269), however, near term oversold condition should prevent sharp fall below 1.2700 and reckon 1.2620-30 (50% Fibonacci retracement) would hold from here and price should stay above previous chart support at 1.2589.
On the upside, whilst initial recovery to 1.2932-33 (current level of the Tenkan-Sen and previous support turned resistance) cannot be ruled out, reckon upside would be limited to 1.2970-80 and resistance at 1.3032 should remain intact, bring another decline later. A daily close above said resistance at 1.3032 would would defer and suggest first leg of decline from 1.3269 has ended instead, risk a stronger rebound to 1.3100 and then 1.3150 but still reckon upside would be limited to 1.3200, bring another leg of corrective decline later. A daily close above 1.3200 would risk another test of said resistance at 1.3269 but break there is needed to confirm recent upmove has resumed and extend gain to 1.3300-10, having said that, loss of upward momentum should prevent sharp move beyond resistance at 1.3425 and price should falter well below 1.3500-05 (50% Fibonacci retracement of 1.5018-1.1986).
Recommendation: Sell at 1.3050 for 1.2850 with stop above 1.3150.
On the weekly chart, cable’s retreat from 1.3269 (with a shooting star) has kept price under pressure, adding credence to our view that a temporary top is possibly formed there and consolidation with mild downside bias is seen for test of 1.2812 support, break there would extend weakness to 1.2775-80 (38.2% Fibonacci retracement of 1.1986-1.3269), then towards 1.2705-10, however, reckon downside would be limited to the Kijun-Sen (now at 1.2689) and previous support at 1.2589 should hold from here. Looking ahead, only a sustained breach below 1.2589 would signal the entire correction from 1.1986 has ended at 1.3269, bring further decline to 1.2500, then towards support at 1.2365.
On the upside, expect recovery to be limited to 1.2930-40 and 1.2980 should hold, bring another decline. Above 1.3032 would defer and suggest the retreat from 1.3269 has ended, risk a strong rebound to 1.3100 but upside should be capped at resistance at 1.3165, bring another decline. Break of 1.3165 resistance would defer and risk retest of 1.3269 but only break there would shift risk back to upside and extend the erratic rise from 1.1986 low for retracement of early downtrend to 1.3300-10 and 1.3350-60, however, upside should be limited to previous resistance at 1.3425 and reckon 1.3500-05 (50% Fibonacci retracement of 1.5018-1.1986) would hold, price should falter below 1.3670-75, bring another decline in Q4.