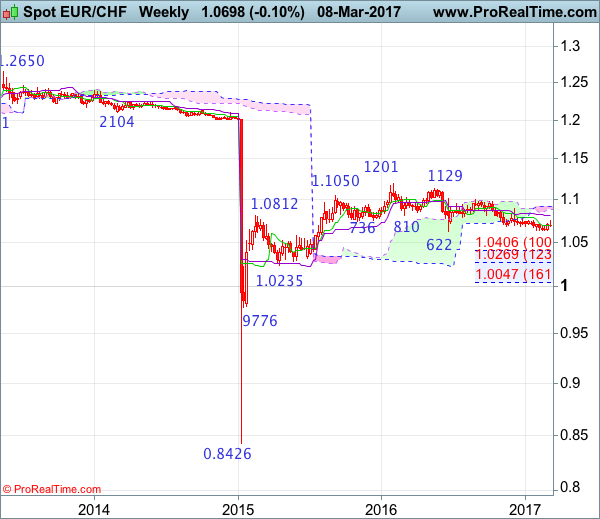
Weekly
- Last Candlesticks pattern: Shooting star
- Time of formation: 1 Feb 2016
- Trend bias: Up
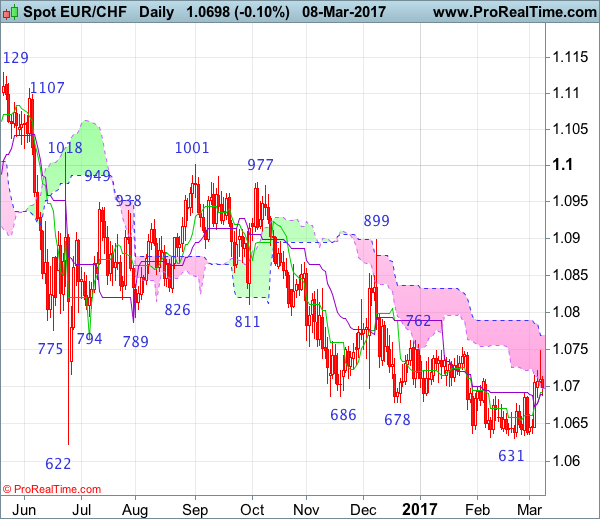
Daily
- Last Candlesticks pattern: Doji
- Time of formation: 1 Sep 2016
- Trend bias: Near term down
EUR/CHF – 1.0708
The single currency continued finding good support just above last month’s low at 1.0631, suggesting further consolidation above this level would be seen and test of resistance at 1.0752 is likely, however, a daily close above there is needed to signal a temporary low is formed, bring a stronger rebound to 1.0785-90, break there would signal recent decline has ended and bring further subsequent gain to 1.0850 but price should falter below key resistance at 1.0899 (Dec high), risk from there is seen for a retreat later.
On the downside, whilst pullback to 1.0660-65 cannot be ruled out, reckon downside would be limited and said strong support at 1.0631 should remain intact, bring another rebound later. Only a break below this support would the erratic decline from 1.1201 (2016 high) has resumed for further fall to 1.0590-00, then towards 1.0530-35 but loss of downward momentum should prevent sharp fall below 1.0500, price should stay well above 1.0400-10, risk from there has increased for a strong rebound to take place later.
Recommendation: Exit short entered at 1.0705 and stand aside for now.
On the weekly chart, as the single currency staged a strong rebound after holding above last month’s low at 1.0631 and a long white candlestick was formed, suggesting consolidation above this level would be seen and test of 1.0752-62 resistance cannot be ruled out, however, a weekly close above the Kijun-Sen (now at 1.0808) is needed to signal a temporary low has been formed at 1.0631, bring retracement of recent decline to 1.0850 but reckon resistance at 1.0899 would hold from here.
On the downside, expect pullback to be limited to 1.0650 and as long as said support at 1.0631 holds, risk of another rebound remains. A drop below indicated support at 1.0622-31 is needed to confirm recent decline from 1.1201 top is still in progress and may extend further fall to 1.0550-55, then 1.0500-10, however, oversold condition should prevent sharp fall below 1.0400-10 (100% projection of 1.1201-1.0622 measuring from 1.1001) and price should stay well above previous support at 1.0314, risk from there is seen for a rebound to take place later.