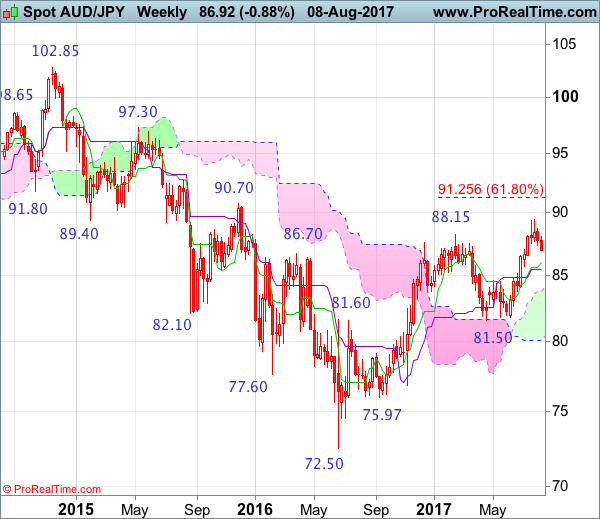
Weekly
• Last Candlesticks pattern: Shooting star
• Time of formation: 13 Mar 2017
• Trend bias: Down
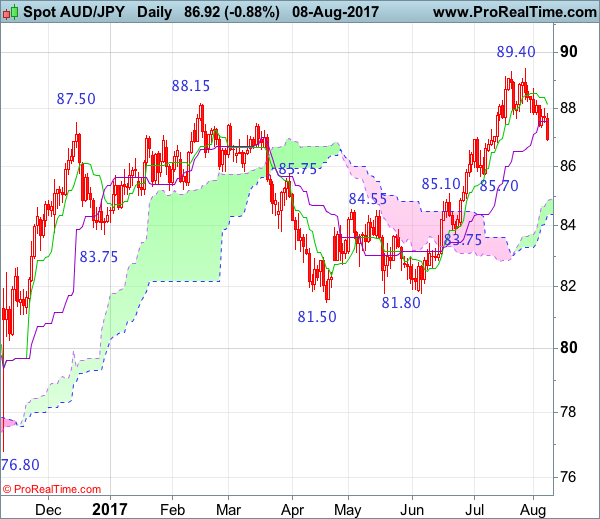
Daily
• Last Candlesticks pattern: Bearish engulfing pattern
• Time of formation: 16 Feb 2017
• Trend bias: Near term down
Although the Australian dollar edged higher to 89.40 late last month, the subsequent retreat suggests consolidation below this level would be seen and pullback to 0.8700 is likely, however, reckon downside would be limited to 86.50-60 and renewed buying interest should emerge around 86.00-10, bring another rise later, above 88.70 would suggest the pullback from 89.40 has ended, bring retest of this level first. Once this recent high is penetrated, this would confirm medium term upmove from 2016 low of 72.50 is still in progress and extend further gain to psychological resistance at 90.00, then towards previous chart resistance at 90.70.
On the downside, whilst initial pullback to 87.00-10 is likely, reckon downside would be limited to 86.60-65 and support at 85.70 should hold, bring another rise later. A daily close below support at 85.70 would suggest top has been formed, brig retracement of recent rise to 85.40-50, then 85.00, however, reckon the upper Kumo (now at 84.85) would limit downside and price should stay above the lower Kumo (now at 84.36), bring rebound later.
Recommendation: Buy at 85.75 for 88.00 with stop below 84.75.
On the weekly chart, aussie’s retreat after rising to 89.40 formed a shooting star and the subsequent black candlestick suggests a minor top is possibly formed, hence consolidation below this level would be seen for correction to 87.00, then 86.50-60, however, reckon downside would be limited to the Tenkan-Sen (now at 86.01) and bring another rise later. Above 88.70 would bring retest of 89.40. A break above there would confirm medium term upmove from 72.50 low (formed back in 2016) is still in progress and extend headway to psychological resistance at 90.00, then test of previous resistance at 90.70, however, overbought condition should limit upside to 91.50-60 and price should falter below another previous chart resistance at 92.70, bring correction later.
On the downside, although initial pullback to 87.00, then 86.50-60 cannot be ruled out, reckon the Tenkan-Sen (now at 86.01) would limit downside and bring another rise later. Below the Kijun-Sen (now at 85.46) would suggest a temporary top is formed instead, bring retracement of recent rise to 85.00, then 84.60-65, however, still reckon the upper Kumo (now at 83.70) would remain intact.