Weekly
• Last Candlesticks pattern: Long white candlestick
• Time of formation: 16 Jan 2017
• Trend bias: Down
Daily
• Last Candlesticks pattern: Long white candlestick
• Time of formation: 18 Apr 2017
• Trend bias: Near term up
GBP/USD – 1.3193
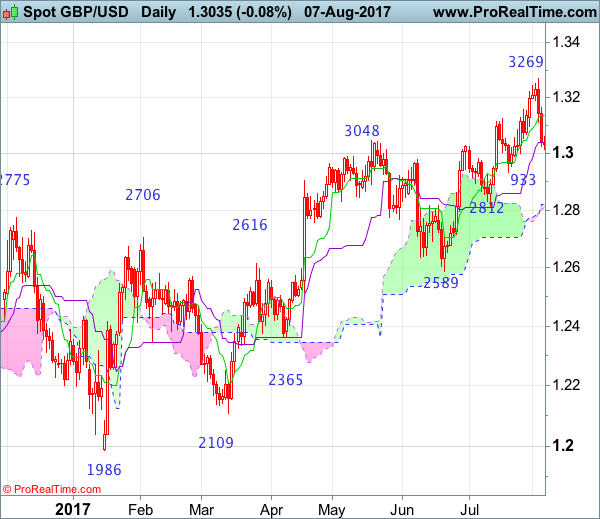
Although cable extended recent upmove to 1.3269 last week, the subsequent sharp retreat suggests a temporary top is possibly formed there and consolidation with mild downside bias is seen for test of support at 1.2999, break there would add credence to this view, bring retracement of recent upmove to another previous support at 1.2933. Once this level is penetrated, this would signal recent upmove is over, bring further fall to 1.2890, then towards previous support at 1.2812 which is expected to contain downside.
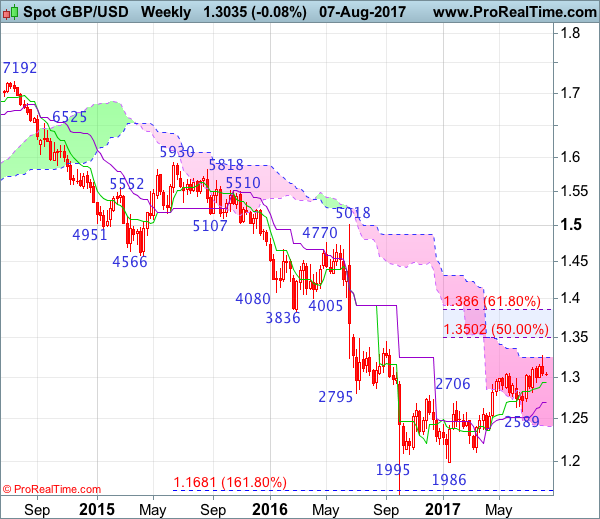
On the upside, whilst recovery to 1.3060-70 cannot be ruled out, if our view that a temporary top formed at 1.3269 is correct, upside should be limited to the Tenkan-Sen (now at 1.3134) and bring another retreat later. Above 1.3200 would risk another test of said resistance at 1.3269 but break there is needed to confirm recent upmove has resumed and extend gain to 1.3300-10, however, loss of upward momentum should prevent sharp move beyond resistance at 1.3425 and price should falter well below 1.3500-05 (50% Fibonacci retracement of 1.5018-1.1986), risk from there is seen for a retreat later.
Recommendation: Sell at 1.3100 for 1.2900 with stop above 1.3200.
On the weekly chart, the British pound has retreated after last week’s brief rise to 1.3269, a black candlestick with a long upper shadow (shooting star alike) was formed, suggesting a temporary top is possibly formed there and consolidation with mild downside bias is seen and if this week ends with a black candlestick, this would add credence to this view, bring test of the Tenkan-Sen (now at 1.2929), a weekly close below this level would bring correction of recent rise to 1.2860-65, then test of 1.2812 support, however, downside would be limited to 1.2700-10 and price should stay well above support at 1.2589, bring a rebound later.
On the downside, although initial pullback to 1.3095-00 is likely, reckon downside would be limited to 1.3050-55 and said support at 1.2999 should hold, bring another rise later. A weekly close below 1.2999 would suggest a temporary top is possibly formed, bring test of 1.2933 support, break there would add credence to this view, then retracement of recent rise to the Tenkan-Sen (now at 1.2895) and later 1.2812 support would follow, however, downside would be limited to 1.2700-10 and price should stay well above support at 1.2589, bring a rebound later.