Weekly
• Last Candlesticks pattern: Shooting star
• Time of formation: 7 Mar 2017
• Trend bias: Sideways
Daily
• Last Candlesticks pattern: Morning star
• Time of formation: 9 May 2017
• Trend bias: Near term up
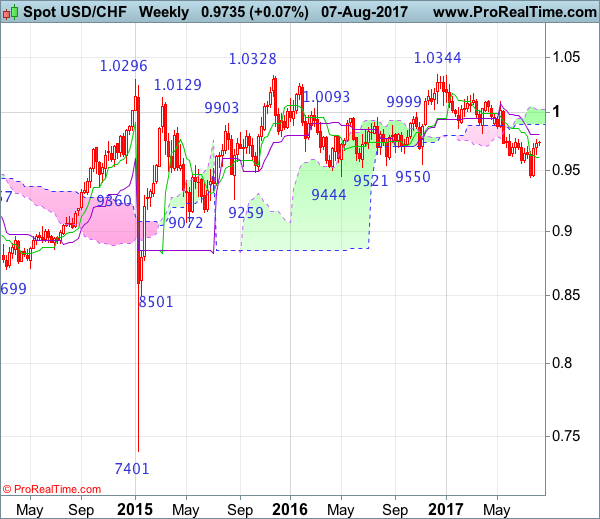
USD/CHF – 0.9731
As the greenback staged a strong rebound after finding good support at 0.9438, suggesting a temporary low has been formed there and consolidation with mild upside bias is seen for test of resistance at 0.9771, however, break of resistance at 0.9808 is needed to add credence to this view, bring retracement of recent decline to 0.9845-50 (61.8% Fibonacci retracement of 1.0100-0.9438), however, near term overbought condition should limit upside to 0.9900-10 and price should falter well below psychological resistance at 1.0000, bring retreat later.
On the downside, whilst initial pullback to 0.9670-75 and possibly the Tenkan-Sen (now at 0.9628) is likely, reckon the Kijun-Sen (now at 0.9602) would limit downside and the greenback shall stage another rebound from there later. Only a drop below support at 0.9490 would abort and signal the rebound from 0.9438 has ended instead, risk retest of this level, once this support is penetrated, this would indicate recent decline from 1.0344 (2016 high) has resumed and extend weakness to 0.9390-00, then towards 0.9330-40.
Recommendation: Buy at 0.9600 for 0.9800 with stop below 0.9500

On the weekly chart, the greenback has edged higher again after forming a long white candlestick, suggesting a temporary low is possibly formed at 0.9438 last month and consolidation with mild upside bias is seen for retracement of recent selloff, hence further gain to 0.9805-08 (current level of the Kijun-Sen and previous resistance) would be seen, above there would add credence to this view, bring correction of recent selloff to 0.9845-50 (61.8% Fibonacci retracement of 1.0100-0.9438) and possibly test of the lower Kumo (now at 0.9894) but price should falter below psychological resistance at 1.0000, bring another decline later.
On the downside, expect pullback to be limited to the Tenkan-Sen (now at 0.9605) and 0.9580 should hold, bring another rise later. Only a drop below support at 0.9490 would abort and suggest the rebound from 0.9438 has ended, bring retest of this level later. Once this recent low is penetrated, this would signal the decline from 1.0344 (2016 high) is still in progress and may extend weakness to 0.9350, then towards 0.9290-00, however, loss of near term downward momentum should prevent sharp fall below 0.9250 and reckon 0.9200-10 would hold from here, risk from there has increased for a rebound later.