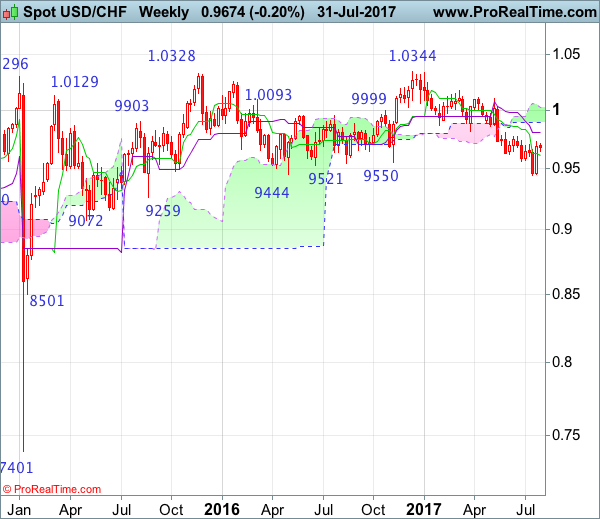
Weekly
• Last Candlesticks pattern: Shooting star
• Time of formation: 7 Mar 2017
• Trend bias: Sideways
Daily
• Last Candlesticks pattern: Morning star
• Time of formation: 9 May 2017
• Trend bias: Near term up
USD/CHF – 0.9467
Despite falling to 0.9438 last month, the subsequent stronger-than-expected rebound suggests a temporary low has been formed there and few weeks of consolidation above this level would take place and initial upside risk is seen for gain to 0.9769-71 (50% Fibonacci retracement of 1.0100-0.9438 and previous resistance), then towards 0.9800, however, as this move is viewed as retracement of recent decline, reckon upside would be limited to 0.9847 (61.8% Fibonacci retracement) and the upper Kumo (now at 0.9857) should hold, bring another decline later.
On the downside, whilst initial pullback to 0.9630-35 is likely, reckon the Tenkan-Sen (now at 0.9583) would limit downside and the greenback shall stage another rebound from there later. Only a drop below support at 0.9490 would abort and signal the rebound from 0.9438 has ended instead, risk retest of this level, once this support is penetrated, this would indicate recent decline from 1.0344 (2016 high) has resumed and extend weakness to 0.9390-00, then towards 0.9330-40.
Recommendation: Stand aside for this week

On the weekly chart, the greenback staged a strong rebound last week and a long white candlestick was formed, suggesting a temporary low is possibly formed at 0.9438 and consolidation with mild upside bias is seen for retracement of recent selloff, hence further gain to 0.9771 resistance would be seen, above there would bring test of the Kijun-Sen (now at 0.9805), however, reckon upside would be limited too 0.9845-50 (61.8% Fibonacci retracement of 1.0100-0.9438) and price should falter below the lower Kumo (now at 0.9894), bring another decline later.
On the downside, expect pullback to be limited to the Tenkan-Sen (now at 0.9605) and 0.9580 should hold, bring another rise later. Only a drop below support at 0.9490 would abort and suggest the rebound from 0.9438 has ended, bring retest of this level later. Once this recent low is penetrated, this would signal the decline from 1.0344 (2016 high) is still in progress and may extend weakness to 0.9350, then towards 0.9290-00, however, loss of near term downward momentum should prevent sharp fall below 0.9250 and reckon 0.9200-10 would hold from here, risk from there has increased for a rebound later.