Weekly
• Last Candlesticks pattern: Marubozu
• Time of formation: 14 Nov 2016
• Trend bias: Down
Daily
• Last Candlesticks pattern: Shooting star
• Time of formation: 15 Feb 2017
• Trend bias: Down
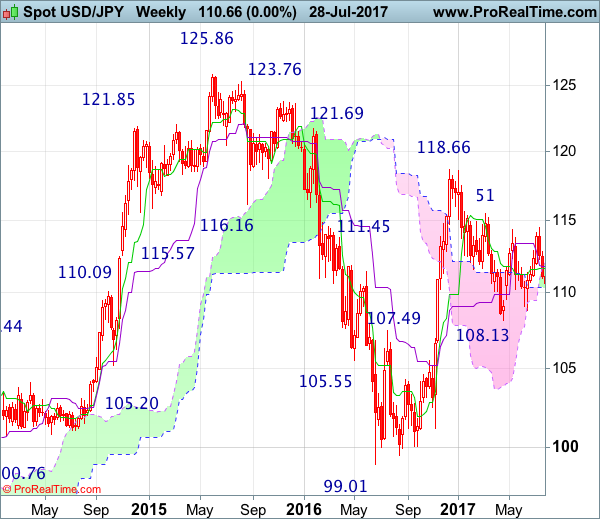
USD/JPY – 110.65
The greenback did meet renewed selling interest at 112.20 last week (we recommended to sell dollar at 112.00 and a short position was entered) and has fallen again since, adding credence to ur bearish view that decline from 114.50 is still in progress and downside bias remains for this move to extend weakness to 110.00, having said that, as broad outlook remains consolidative, reckon downside would be limited to 109.40 and said support at 108.82 should remain intact.
On the upside, whilst initial recovery to the Tenkan-Sen (now at 111.37) cannot be ruled out, reckon upside would be limited and resistance at 111.71 would hold, bring another decline later. A daily close above said resistance at 111.71 would defer and risk test of 112.20 but break there is needed to signal the aforesaid decline from 114.50 has ended, bring a stronger rebound to 112.85-90 first.
Recommendation : Hold short entered at 112.00 for 110.00 with stop lowered to 111.75.

On the weekly chart, as dollar has remained under pressure after brief bounce to 112.20 last week, adding credence to our view that top has been formed at 114.50 and consolidation with downside bias remains for weakness to 110.00, then 109.40, however, reckon 108.82-84 (previous support as well as current level of the lower Kumo) would limit downside and price should stay well above support at 108.13, bring recovery later.
On the upside, although recovery to 111.10-20 cannot be ruled out, reckon the Tenkan-Sen (now at 111.66) would limit upside and bring another decline later. Only above said resistance at 112.20 would signal the retreat from 114.50 has possibly ended, bring a stronger rebound to 112.42, then towards 113.00, however, reckon upside would be limited to 113.55-60 and price should falter well below said resistance at 114.50. Only a break above 114.50 would signal the rebound from 108.13 is still in progress for gain towards resistance at 115.51 but a weekly close above there is needed to signal the fall from 118.66 top has ended at 108.13, then headway to 116.00-10 would follow but resistance at 117.53 should hold from here.