Weekly
• Last Candlesticks pattern: Long white candlestick
• Time of formation: 16 Jan 2017
• Trend bias: Down
Daily
• Last Candlesticks pattern: Long white candlestick
• Time of formation: 18 Apr 2017
• Trend bias: Near term up
GBP/USD – 1.020
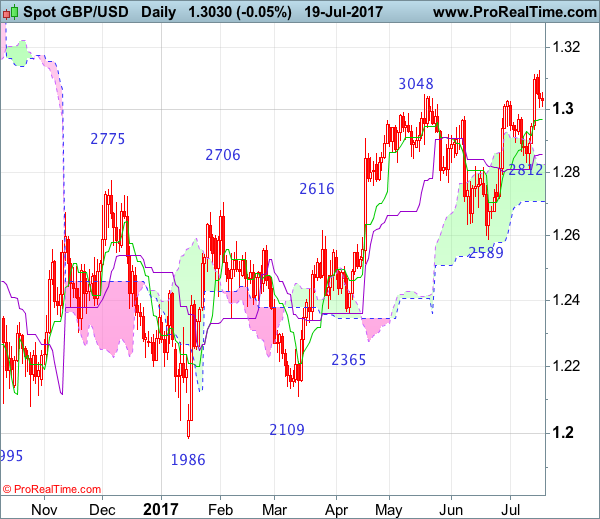
Although cable extended recent upmove to as high as 1.3126 earlier this week, the quick retreat from there suggests a week of consolidation below this level would be seen and mild downside bias is for test of the Tenkan-Sen (now at 1.2969), below there would extend weakness to the Kijun-Sen (now at 1.2858), however, only a daily close below support at 1.2812 would signal a temporary top is formed there, bring retracement of recent upmove to 1.2790-00, then towards 1.2730-35, having said that, reckon the lower Kumo (now at 1.2707) would limit downside and price should stay well above support at 1.2589, bring rebound later.
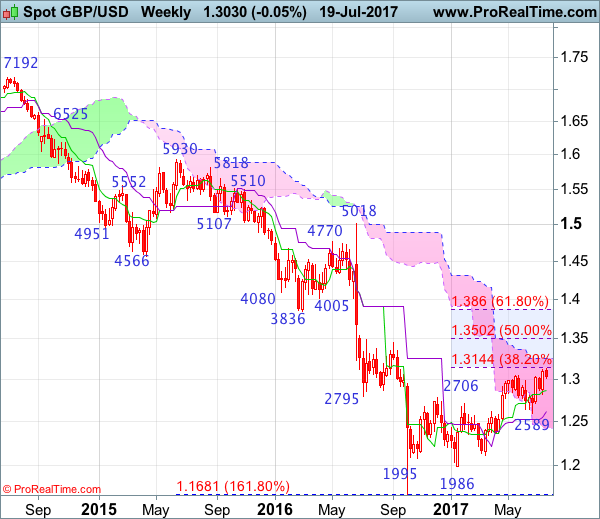
On the upside, expect recovery to be limited to 1.3050-60 and bring another retreat later. Above said resistance at 1.3126 would extend recent erratic upmove from 1.1986 low to 1.3140-45 (38.2% Fibonacci retracement of 1.5018-1.1986), then towards 1.3200, however, reckon upside would be limited to 1.3250-60 and price should falter well below 1.3300, risk from there is seen for a retreat later.
Recommendation: Sell at 1.3040 for 1.2840 with stop above 1.3140
On the weekly chart, although cable continued edging higher after breaking above previous resistance at 1.3048, loss of near term upward momentum should prevent sharp move beyond 1.3140-50 (38.2% Fibonacci retracement of 1.5018-1.1986) and reckon upside would be limited to the upper Kumo (now at 1.3247), the British pound’s upside should falter below 1.3300-10, bring retreat later next month or in late Q3.
On the downside, initial pullback to 1.2960-70 and then 1.2900 is likely, however, reckon the Tenkan-Sen (now at 1.2858) would limit downside. Only a break below support at 1.2812 would suggest a temporary top is possibly formed, bring weakness to 1.2755-60, then test of support at 1.2706 but cable needs to penetrate support at 1.2589 to provide confirmation, bring retracement of recent upmove to 1.2550 and possibly towards previous support at 1.2515 which is expected to hold from here.