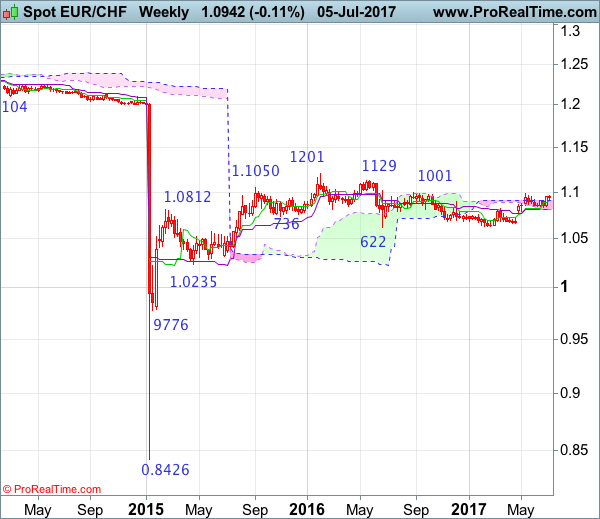
Weekly
• Last Candlesticks pattern: Doji
• Time of formation: 20 Feb 2017
• Trend bias: Up
Daily
• Last Candlesticks pattern: Doji
• Time of formation: 1 Sep 2016
• Trend bias: Near term down
EUR/CHF – 1.0958
As the single currency has maintained a firm undertone after staging a strong rebound from 1.0833, adding credence to our bullish view that correction from 1.0988 has ended and upside bias remains for test of this level, break there would encourage for headway to previous resistance at 1.1001. Looking ahead, only a break above there would retain bullishness and bring subsequent rise to 1.1050-60, then 1.1100, having said that, price should falter below another previous resistance at 1.1201.
On the downside, whilst pullback to 1.0920-25 cannot be ruled out, reckon the Tenkan-Sen (now at 1.0906) would limit downside and bring another rise to aforesaid upside targets. A daily close below the Kijun-Sen (now at 1.0900) would defer and risk weakness to 1.0845 but only break there would signal another leg of corrective fall from 1.0988 is underway for test of 1.0833, then towards previous support at 1.0792 which is likely to hold from here.
Recommendation: Hold long entered at 1.0865 for 1.1065 with stop below 1.0835.

On the weekly chart, last week’s rebound did form a long white candlestick as suggested in our previous update and bullishness remains for gain to resistance at 1.0988, however, above there is needed to retain bullishness and extend recent upmove from 1.0631 to previous resistance at 1.1001, a sustained breach above this level would signal the fall from 1.1201 has ended, bring further gain to 1.1100 and possibly test of resistance at 1.1129 but price should falter below said recent high at 1.1201.
On the downside, whilst pullback to the Tenkan-Sen (now at 1.0911) cannot be ruled out, price should stay well above indicated support at 1.0833, bring another rebound later. A break of said support at 1.0833 would risk test of the Kijun-Sen (now at 1.0810) but only break of previous support at 1.0780 would abort and signal top has been formed at 1.0988 instead, bring further weakness to 1.0720, however, still reckon support at 1.0656 would remain intact, bring another rebound later.