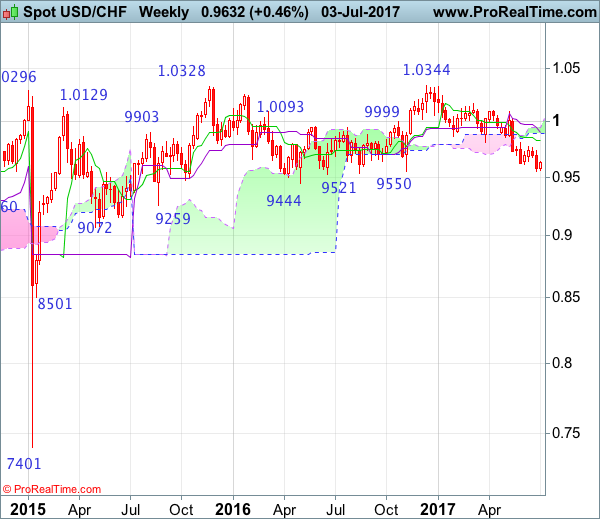
Weekly
• Last Candlesticks pattern: Shooting star
• Time of formation: 7 Mar 2017
• Trend bias: Sideways
Daily
• Last Candlesticks pattern: Morning star
• Time of formation: 9 May 2017
• Trend bias: Near term up
USD/CHF – 0.9628
Although the greenback resumed recent decline and fell to as low as 0.9552 (just held above previous chart support at 0.9550), the subsequent rebound formed a white candlestick yesterday and consolidation above this level would be seen, above the Tenkan-Sen (now at 0.9648) would bring test of the Kijun-Sen (now at 0.9680) but a daily close above this level is needed to add credence to this view, bring retracement of recent decline to 0.9700, then test of 0.9738 resistance. A break above there would encourage for a stronger rebound to previous resistance at 0.9771 but reckon resistance at 0.9808 would hold on first testing.
On the downside, whilst pullback to 0.9590-00 cannot be ruled out, said support at 0.9552 should hold and bring another rebound to aforesaid retracement targets. Below indicated support at 0.9550-52) would signal recent decline from 1.0344 top (2016 high) is still in progress and may extend further weakness to psychological support at 0.9500, having said that, loss of downward momentum should prevent sharp fall below another previous chart support at 0.9444 and risk from there has increased for a rebound later.
Recommendation: Buy at 0.9600 for 0.9800 with stop below 0.9500

On the weekly chart, although the greenback dropped again last week to as low as 0.9552, dollar needs to penetrate support at 0.9550 to retain bearishness and extend the decline from 1.0344 to 0.9500, then towards another previous support at 0.9444, however, loss of near term downward momentum should prevent sharp fall below 0.9400 and reckon 0.9350 would hold from here, risk from there has increased for a rebound later.
On the upside, although initial recovery to 0.9700 and then 0.9735-40 cannot be ruled out, reckon resistance at 0.9808 would limit upside and bring another decline. A weekly close above the Tenkan-Sen (now at 0.9826) would defer and risk a stronger rebound to 0.9940-50 but 1.0007 (previous resistance) should limit upside and price should falter well below 1.0100, bring another selloff later. Above 1.0100 would signal low is formed instead and suggest the aforesaid decline from 1.0344 has ended, bring test of 1.0171 resistance next.