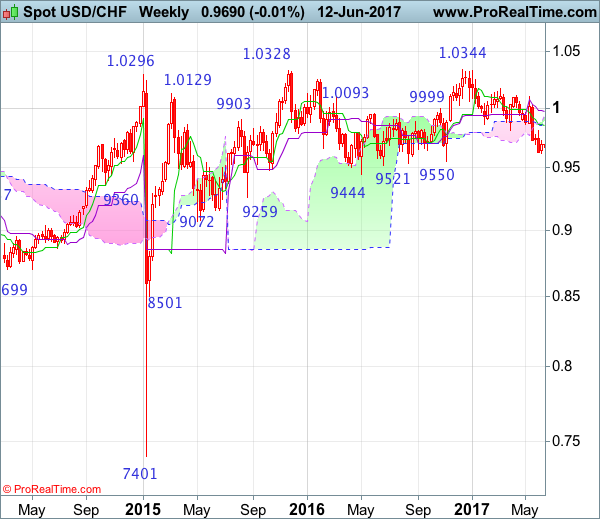
Weekly
• Last Candlesticks pattern: Shooting star
• Time of formation: 7 Mar 2017
• Trend bias: Sideways
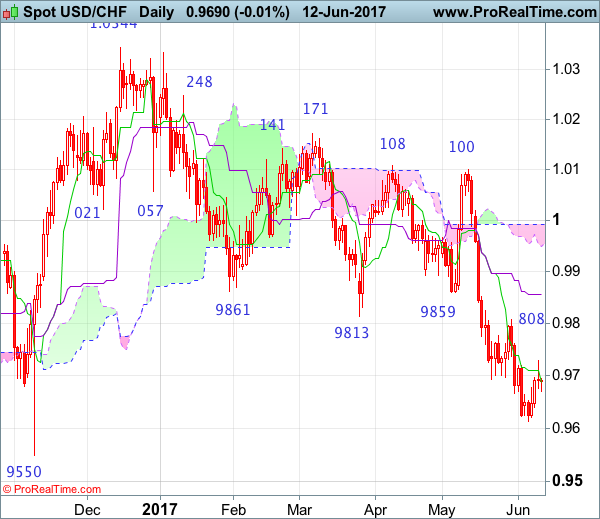
Daily
• Last Candlesticks pattern: Morning star
• Time of formation: 9 May 2017
• Trend bias: Near term up
USD/CHF – 0.9690
As the greenback has recovered after falling to 0.9613, suggesting consolidation above this level would be seen and another bounce to 0.9725-30 is likely, however, reckon upside would be limited to resistance at 0.9808 and bring another decline later, below said support at 0.9613 would extend recent decline from 1.0344 top (2016 high) towards support at 0.9550 but near term oversold condition should prevent sharp fall below this level and price should stay above psychological level at 0.9500, risk from there has increased for a rebound later.
On the upside, whilst initial recovery to 0.9725-30 and 0.9760-70 is likely, reckon upside would be limited to said resistance at 0.9808, bring another decline. A daily close above 0.9857-59 (current level of the Kijun-Sen and previous support now resistance) would defer and suggest a temporary low is formed, bring a stronger rebound to the lower Kumo (now at 0.9949) but price should falter below 1.0000 and bring another selloff.
Recommendation: Sell at 0.9805 for 0.9605 with stop above 0.9905
On the weekly chart, as the greenback has remained under pressure recent selloff, adding credence to our bearish view that early erratic fall from 1.0344 top is still in progress, hence bearishness remains for this move to bring retracement of early upmove to 0.9600, then towards previous support at 0.9550, however, reckon downside would be limited to 0.9500 and another previous support at 0.9444 should remain intact, risk from there has increased for a strong rebound later.
On the upside, although initial recovery to 0.9750-60 cannot be ruled out, reckon said resistance at 0.9808 would limit upside and bring another decline. A weekly close above the Tenkan-Sen (now at 0.9857) would defer and risk a stronger rebound to 0.9940-50 but 1.0007 (previous resistance) should limit upside and price should falter well below 1.0100, bring another selloff later. Above 1.0100 would signal low is formed instead and suggest the aforesaid decline from 1.0344 has ended, bring test of 1.0171 resistance next.