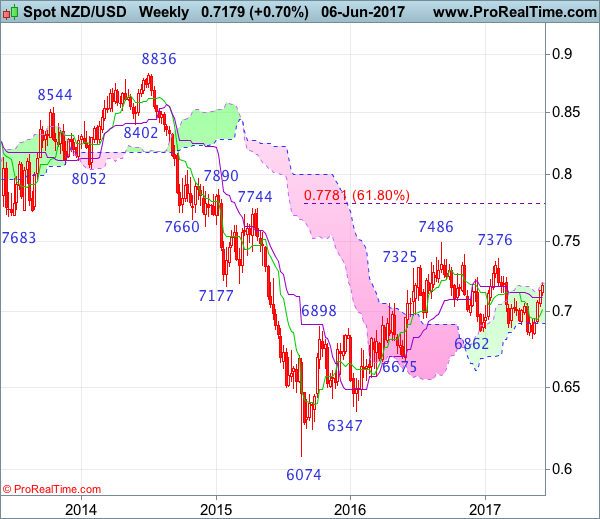
Weekly
• Last Candlesticks pattern: Shooting star
• Time of formation: 5 Sep 2016
• Trend bias: Down
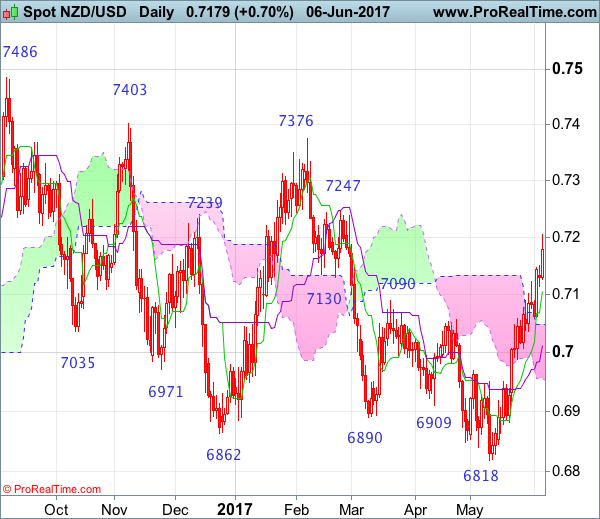
Daily
• Last Candlesticks pattern: Hammer
• Time of formation: 14 Mar 2017
• Trend bias: Near term up
NZD/USD – 0.6974
As kiwi’s rise from 0.6820 (last month’s low) has gathered momentum after breaking resistance at 0.7090, adding credence to our view that low has been formed at 0.6820, hence consolidation with upside bias remains for this rebound to extend further gain to 0.7243-47 resistance but a daily close above this level is needed to provide confirmation and signal erratic decline from 0.7486 top has ended, bring subsequent rise to 0.7300-10 but price should falter below another previous resistance at 0.7376 due to near term overbought condition.
On the downside, whilst initial pullback to the Tenkan-Sen (now at 0.7106) cannot be ruled out, reckon downside would be limited to the upper Kumo (now at 0.7048) and bring another rise later to aforesaid upside targets. Only a daily close below the Kijun-Sen (now at 0.7012) would abort and suggest top is formed instead, risk weakness to 0.6988 and possibly towards the lower Kumo (now at 0.6952) but downside should be limited to 0.6900 and support at 0.6881 should remain intact.
Recommendation: Buy at 0.7100 for 0.7300 with stop below 0.7000.
On the weekly chart, kiwi has rallied for the past 4 consecutive weeks after finding decent demand at 0.6818 last month, suggesting low has indeed been formed there and consolidation with upside bias is seen for gain to 0.7245-50, then 0.7300, however, break of previous resistance at 0.7376 is needed to retain bullishness and signal the erratic decline from 0.7486 top has ended earlier, bring subsequent headway to 0.7400-10 but price should falter below said recent high, bring retreat later.
On the downside, although pullback to 0.7100-05 is likely, reckon last week’s low at 0.7035 would limit downside and bring another rise later. A weekly close below the Kijun-Sen (now at 0.7097) is needed to suggest top is possibly formed, risk test of the Tenkan-Sen (now at 0.7012) but downside should be limited to 0.6950 and bring another rebound later. Below 0.6915-20 would defer and suggest the rebound from 0.6820 has possibly ended instead, risk further fall to 0.6880 first. but said recent low at 0.6820 should hold on first testing.