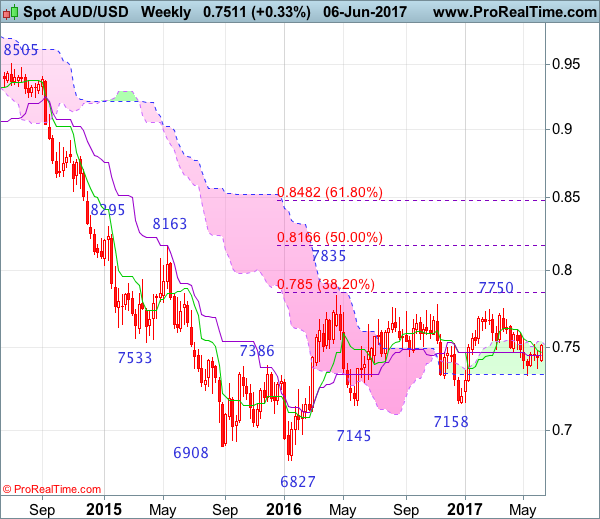
Weekly
• Last Candlesticks pattern: Shooting doji
• Time of formation: 20 Feb 2017
• Trend bias: Sideways
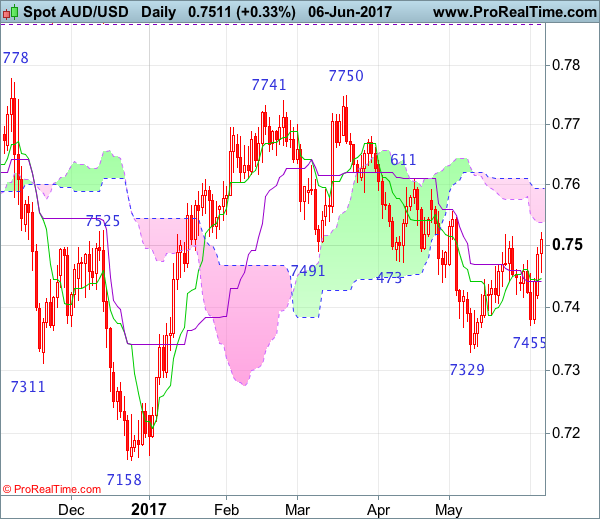
Daily
• Last Candlesticks pattern: Bearish engulfing pattern
• Time of formation: 21 Mar 2017
• Trend bias: Near term down
Aussie has rallied after finding renewed buying interest at 0.7372 last week on broad-based weakness in the greenback, the subsequent break of resistance at 0.7518 signals a temporary low has been formed at 0.7329, hence consolidation with upside bias is seen for the rebound from there to extend gain to another previous resistance at 0.7611, having said that, aussie needs to break this level to signal the fall from 0.7750 top has ended and bring subsequent rise towards resistance at 0.7680 but price should falter below chart resistance at 0.7750.
On the downside, whilst initial pullback to 0.7500 and possibly towards the Tenkan-Sen (now at 0.7464) cannot be ruled out, reckon downside would be limited to 0.7415-20 and bring another rebound later. Only below said support at 0.7372 would revive bearishness and suggest the rebound from 0.7329 has ended, bring retest of this level, break there would extend recent fall from 0.7750 top to 0.7300 and possibly 0.7250-60 but reckon downside would be limited to 0.7200-10 and price should stay well above indicated previous chart support at 0.7158.
Recommendation: Stand aside for this week.
On the weekly chart, aussie found good support at 0.7372 and has staged a strong rebound (a long white candlestick looks set to be formed this week), adding credence to our view that low has been formed at 0.7329, hence consolidation with upside bias is seen for further gain towards previous resistance at 0.7611, however, break there is needed to signal the fall from 0.7750 has ended at 0.7329, bring further gain towards resistance at 0.7680, having said that, price should falter below said resistance at 0.7750.
On the downside, although pullback to 0.7500 cannot be ruled out, reckon the Tenkan-Sen (now at 0.7470) would limit downside and bring another rebound. A weekly close below the Kijun-Sen (now at 0.7454) would risk weakness to 0.7400 but only break of said support at 0.7372 would suggest the rebound from 0.7329 has ended and revive bearishness for reset of tis level. A break there would extend recent decline from 0.7750 to 0.7290-00 and possibly towards 0.7230, however, downside should be limited to 0.7200 and price should stay well above previous support at 0.7158, risk from there is seen for a rebound to take place later.