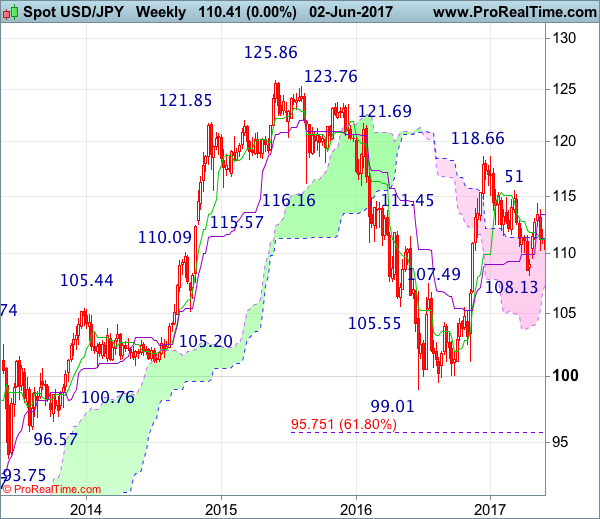
Weekly
• Last Candlesticks pattern: Marubozu
• Time of formation: 14 Nov 2016
• Trend bias: Down
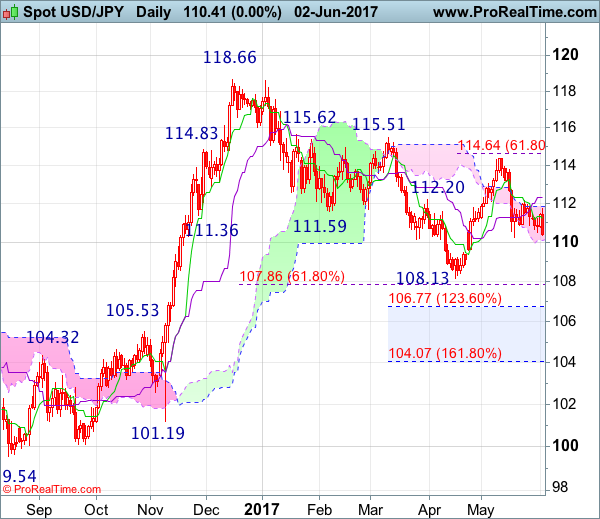
Daily
• Last Candlesticks pattern: Shooting star
• Time of formation: 15 Feb 2017
• Trend bias: Down
USD/JPY – 110.47
Although dollar rebounded initially last week, renewed selling interest emerged at 111.71 and the greenback has dropped sharply on Friday after NFP data, suggesting the fall from 1114.37 is still in progress and retest of previous support at 110.24 is likely, however, a break below there is needed to retain bearishness and extend this fall to 110.00, then towards 109.59 support, having said that, loss of downward momentum should prevent sharp fall below minor support at 108.88 and price should stay well above recent low at 108.13, bring another rebound later.
On the upside, whilst recovery back to 110.90-00 cannot be ruled out, reckon the Tenkan-Sen (now at 111.22) would limit upside and bring another decline later. Only above said resistance at 111.71 (Friday’s high) would abort and prolong consolidation, bring test of resistance at 111.95, then 112.13 resistance, break there would bring a stronger rebound to 112.45-50 (61.8% Fibonacci retracement of 113.85-110.24) and possibly towards 113.10-15 but upside should be limited to 113.85 and price should falter well below indicated resistance at 114.37.
Recommendation : Sell at 111.00 for 109.00 with stop above 112.00.
On the weekly chart, dollar ran into heavy offers at 111.71 and has slipped again, suggesting the retreat from 114.37 is still in progress and break of previous support at 110.24 would bring further decline to 109.59 support, however, a weekly close below there is needed to add credence to our view that the rebound from 108.13 has ended, bring subsequent weakness to 108.85-90 but said support at 108.13 should remain intact. In the event dollar drops below said support at 108.13, this would signal the fall from 118.66 top has resumed and extend weakness towards previous resistance at 107.49.
On the upside, expect recovery to be limited to 111.00 and resistance at 111.71 should hold, bring another decliner. Above said resistance at 111.71 would bring test of previous resistance at 112.13 but only break there would defer and risk a stronger rebound to 112.45-50, then 112.70-75, break there would suggest the retreat from 114.37 has ended instead, bring test of 113.10-15, then towards the Kijun-Sen (now at 113.40) but break of 113.85 is needed to signal another leg of rebound from 110.24 is underway for a retest of 114.37 later. Looking ahead, only break of said resistance at 114.37 would extend the rise from 108.13 to 114.60-65 (61.8% Fibonacci retracement of 118.66-108.13), then towards resistance at 115.51 which is likely to hold from here.