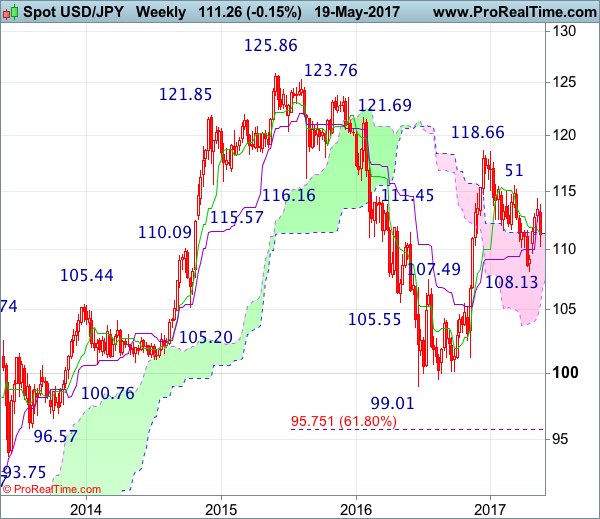
Weekly
• Last Candlesticks pattern: Marubozu
• Time of formation: 14 Nov 2016
• Trend bias: Down
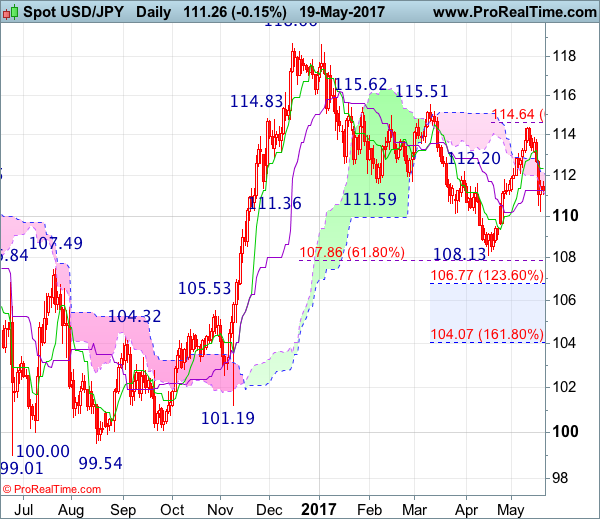
Daily
• Last Candlesticks pattern: Shooting star
• Time of formation: 15 Feb 2017
• Trend bias: Down
USD/JPY – 111.48
Despite rising to 114.37 earlier this month, the subsequent stronger-than-expected retreat suggest top has been formed there and downside risk remains for weakness to 110.00-10, however, reckon downside would be limited to 109.59 support and minor support at 108.88 should hold, price should stay well above recent low at 108.13, bring rebound later.
On the upside, whilst the recovery from 110.24 may bring recovery to 111.70-75, reckon upside would be limited to the upper Kumo (now at 112.12) and the Tenkan-Sen (now at 112.31) should hold, bring another decline. Above 112.73 would bring recovery to 113.10-15 but only a daily close above there would suggest low is formed, bring a stronger rebound to 113.85, having said that, upside should be limited and price should falter below resistance at 114.37.
Recommendation : Stand aside for this week
On the weekly chart, last week’s stronger-than-expected retreat dampened our bullishness and suggesting the rebound from 108.13 has ended there, hence consolidation with mild downside bias is seen for weakness to 110.00-10, however, break of 109.59 support is needed to add credence to this view, bring further fall to 108.85-90 but said support at 108.13 should remain intact. In the event dollar drops below said support at 108.13, this would signal the fall from 118.66 top has resumed and extend weakness towards previous resistance at 107.49.
On the upside, expect recovery to be limited to 112.00-05 and previous support at 112.39 should hold, bring another decline later. Above 112.70-75 would risk a stronger rebound to 113.10-15, however, break there is needed to signal the retreat from 114.37 has ended instead, bring further gain to the Kijun-Sen (now at 113.40) but break of 113.85 is needed to confirm and bring retest of 114.37 later. Looking ahead, only break of said resistance at 114.37 would extend the rise from 108.13 to 114.60-65 (61.8% Fibonacci retracement of 118.66-108.13), then towards resistance at 115.51 which is likely to hold from here.