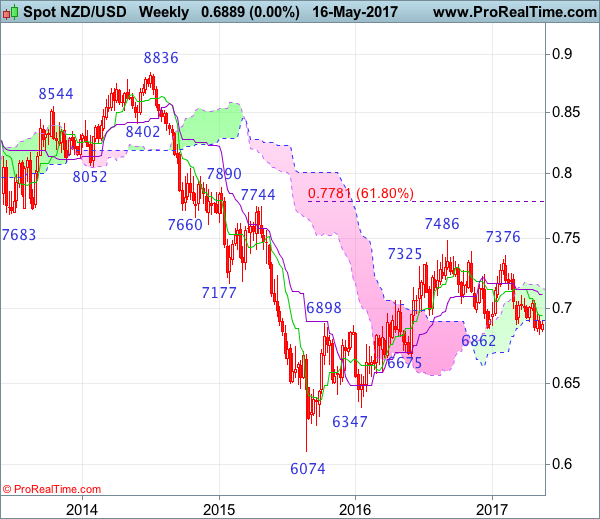
Weekly
• Last Candlesticks pattern: Shooting star
• Time of formation: 5 Sep 2016
• Trend bias: Down
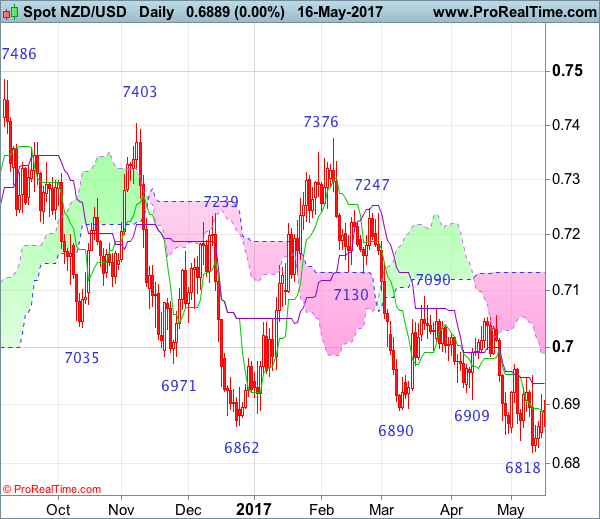
Daily
• Last Candlesticks pattern: Hammer
• Time of formation: 14 Mar 2017
• Trend bias: Near term up
NZD/USD – 0.6974
Although kiwi fell briefly to 0.6818 support, lack of follow through selling on break of previous support at 0.6839 and the subsequent recovery suggest consolidation above this level would be seen and test of the Kijun-Sen (now at 0.6937) is likely, however, a daily close above resistance at 0.6969 is needed to signal a temporary low is formed, bring retracement of recent decline to 0.7015 and possibly towards resistance at 0.7056. Having said that, price should falter below resistance at 0.7090 and kiwi shall head south again from there later this month.
On the downside, below said support at 0.6818 would signal the fall from 0.7486 is still in progress and may extend weakness to 0.6780 (50% Fibonacci retracement of 0.6074-0.7486), however, near term oversold condition should prevent sharp fall below 0.6700 and reckon 0.6675 support would hold from here, price should stay well above 0.6610-15 (61.8% Fibonacci retracement), risk from there is seen for a rebound to take place later.
Recommendation: Stand aside for this week.
On the weekly chart, although kiwi has remained under pressure, initial upside risk has increased for a corrective bounce to the Tenkan-Sen (now at 0.6954) and possibly towards 0.7000, however, reckon upside would be limited to 0.7045-50 and price should falter below the Kijun-Sen (now at 0.7097), bring another decline later. Below support at 0.6818 would extend recent fall from 0.7486 top to 0.6780 (50% Fibonacci retracement of 0.6074-0.7486) and later towards previous chart support at 0.6675, however, reckon downside would be limited to 0.6610-15 (61.8% Fibonacci retracement) and price should stay above 0.6550, bring rebound later.
On the upside, whilst recovery to the Tenkan-Sen (now at 0.6954) and possibly 0.7000 cannot be ruled out, reckon upside would be limited to 0.7045-50 and the Kijun-Sen (now at 0.7097) should hold, bring another decline later. A weekly close above the Kijun-Sen would suggest a temporary low is formed, bring retracement of recent decline to the upper Kumo (now at 0.7141) and then towards 0.7200 but resistance at 0.7247 should remain intact and price should falter well below 0.7300, bring further broad consolidation later.