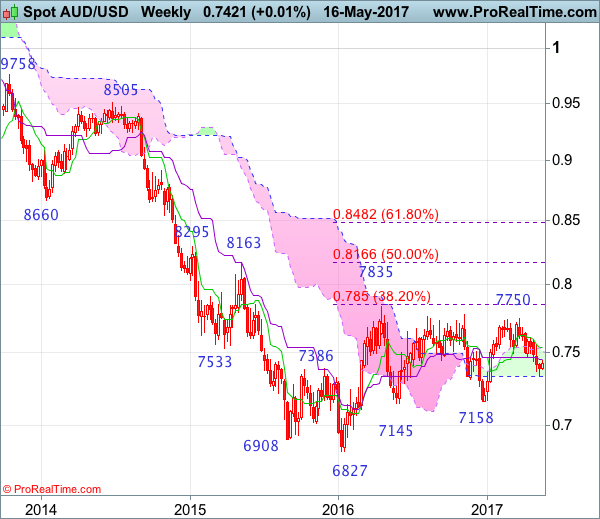
Weekly
• Last Candlesticks pattern: Shooting doji
• Time of formation: 20 Feb 2017
• Trend bias: Sideways
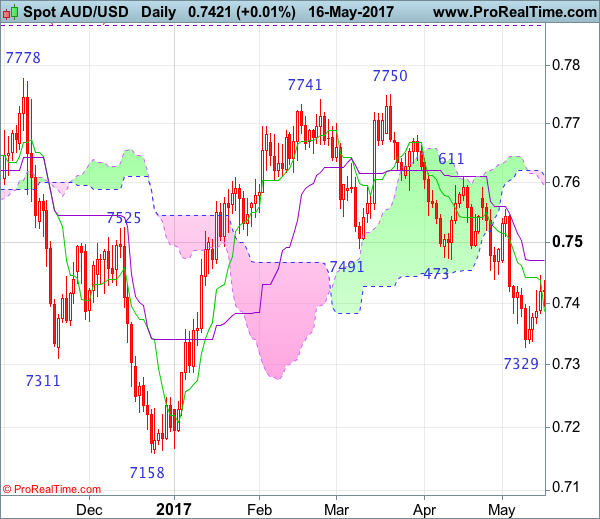
Daily
• Last Candlesticks pattern: Bearish engulfing pattern
• Time of formation: 21 Mar 2017
• Trend bias: Near term down
As aussie has recovered after falling to 0.7329 last week, suggesting consolidation above this level would be seen, however, reckon upside would be limited to the Kijun-Sen (now at 0.7470) and bring another decline later, below said support at 0.7329 would extend recent fall from 0.7750 top to 0.7300 and possibly 0.7250-60 but oversold condition should prevent sharp fall below 0.7200-10 and price should stay well above indicated previous chart support at 0.7158, bring rebound later.
On the upside, whilst marginal recovery from here cannot be ruled out, reckon the Kijun-Sen (now at 0.7470) would limit upside and bring another decline later. A daily close above 0.7490-00 would defer and risk a stronger rebound towards resistance at 0.7556 but break there is needed to signal a temporary low is formed instead, bring a stronger rebound to 0.7590-95 but price should falter below resistance at 0.7611 and bring another decline later.
Recommendation: Hold short entered at 0.7440 for 0.7240 with stop above 0.7540.
On the weekly chart, although aussie recovered after falling to 0.7329 last week and minor consolidation above this level would be seen, reckon upside would be limited to previous support at 0.7473 and bring another decline later, below said support at 0.7329 would extend recent decline from 0.7750 to 0.7290-00 and possibly towards 0.7230, however, downside should be limited to 0.7200 and price should stay well above previous support at 0.7158, risk from there is seen for a rebound to take place later.
On the upside, expect recovery to be limited to the Kijun-Sen (now at 0.7454) and bring another decline later. Above the upper Kumo (now at 0.7508) would risk test of the Tenkan-Sen (now at 0.7540 but only break of indicated resistance at 0.7556 would abort and signal low is formed instead, risk a stronger rebound to 0.7590-95, however, break of resistance at 0.7611 is needed to add credence to this view, bring further gain towards resistance at 0.7680, having said that, price should falter below said resistance at 0.7750.