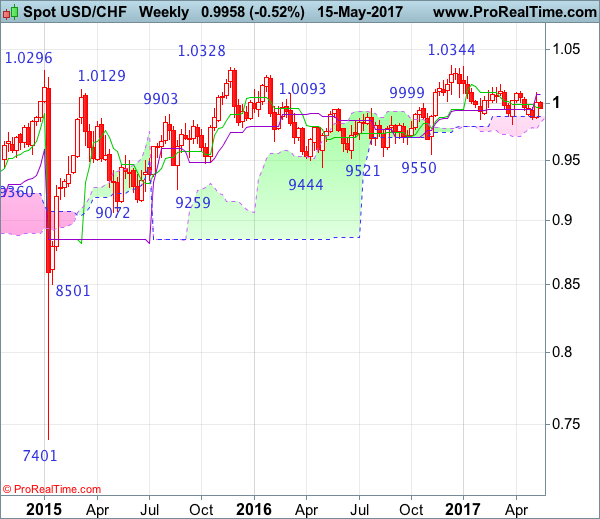
Weekly
• Last Candlesticks pattern: Shooting star
• Time of formation: 7 Mar 2017
• Trend bias: Sideways
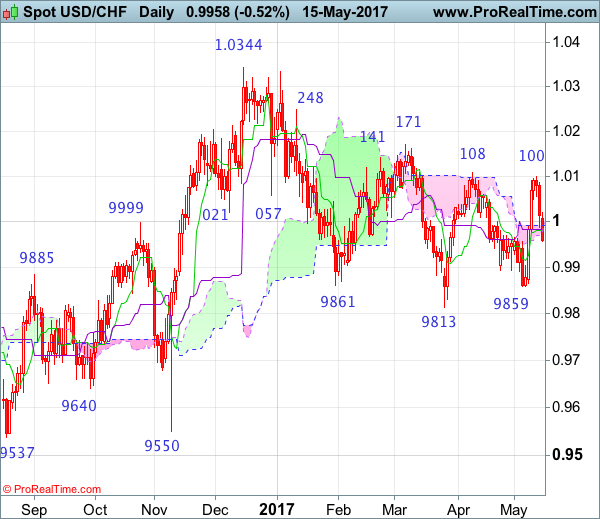
Daily
• Last Candlesticks pattern: Morning star
• Time of formation: 9 May 2017
• Trend bias: Near term up
USD/CHF – 0.9944
Although the greenback rose to as high as 1.0100 last week, the subsequent retreat after faltering below previous resistance at 1.0108 suggests further consolidation would be seen, however, reckon downside would be limited to 0.9900-05 and bring another rebound later, above 1.0045-50 would bring retest of 1.0100-08 resistance but break there is needed to retain bullishness and signal another rise from 0.9813 low is underway for headway to 1.0150 and possibly test of resistance at 1.0171 which is likely to hold from here.
On the downside, expect pullback to be limited to 0.9900-05 and bring another rebound later. Below said support at 0.9859 would abort and risk retest of previous support at 0.9813 but only a drop below this support would indicate the decline from 1.0344 top has resumed instead and extend further fall to 0.9735-40 (76.4% retracement of 0.9550-1.0344) and later towards 0.9700, however, near term oversold condition should limit downside to 0.9650-60 and reckon 0.9600 would hold, bring rebound later.
Recommendation: Hold long entered at 0.9970 for 1.0170 with stop below 0.9870.
On the weekly chart, failure to extend last week’s rebound and the subsequent retreat after faltering below previous resistance at 1.0108 suggest further consolidation would be seen and weakness to 0.9900 cannot be ruled out, however, as long as support at 0.9859 holds, prospect of another rebound remains, above 1.0045-50 would bring another rise to 1.0100-08 resistance area but break there is needed to retain bullishness and signal another leg of rise from 0.9813 low is underway for test of previous resistance at 1.0171. Looking ahead, a weekly close above there is needed to signal the fall from 1.0344 (Dec high) has ended, bring further rise to 1.0248, a sustained breach above this key level would signal early upmove has possibly resumed, bring test of 1.0335-44 resistance area, above there would provide confirmation and headway to 1.0400-10 and later 1.0500 would follow.
On the downside, although initial marginal weakness from here cannot be ruled out, reckon downside would be limited to 0.9900 and bring another rebound later. Below said support at 0.9859 would bring test of strong support at 0.9813 but only break of this level would abort and signal the erratic fall from 1.0344 top is still in progress, bring further decline for retracement of early upmove to 0.9735-40, then 0.9700 but reckon downside would be limited to 0.9640-50 and price should stay well above support at 0.9550.