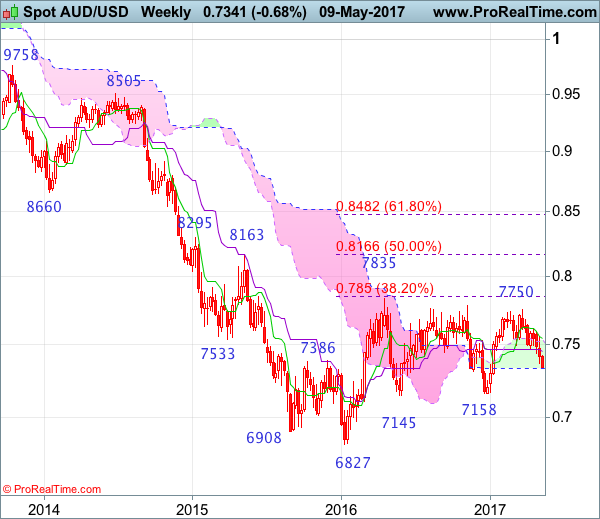
Weekly
• Last Candlesticks pattern: Shooting doji
• Time of formation: 20 Feb 2017
• Trend bias: Sideways
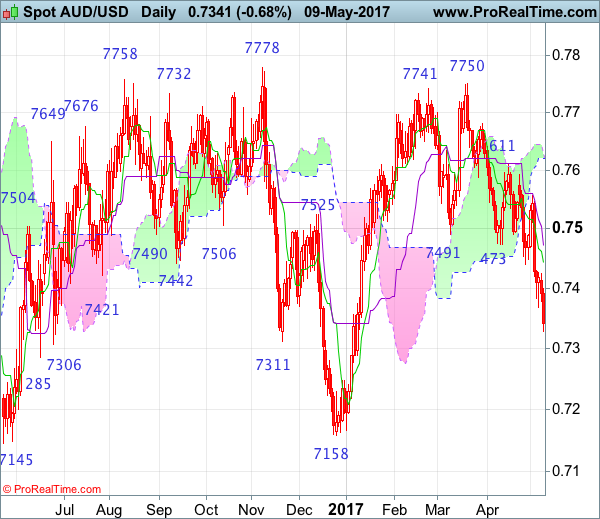
Daily
• Last Candlesticks pattern: Bearish engulfing pattern
• Time of formation: 21 Mar 2017
• Trend bias: Near term down
As aussie has dropped again after brief, adding credence to our bearish view (our short position entered at 0.7590 met target at 0.7390 with 200 points profit) and downside bias remains for the decline from 0.7750 to bring at least a strong retracement of the rise from 0.7158, hence further weakness to 0.7300-10 and possibly 0.7250-60 is underway, however, near term oversold condition should prevent sharp fall below 0.7200-10 and price should stay well above support at 0.7158.
On the upside, whilst initial recovery to 0.7400 cannot be ruled out, reckon the Tenkan-Sen (now at 0.7443) would limit upside and bring another decline later. A daily close above 0.7490-00 would defer and risk a stronger rebound towards resistance at 0.7556 but break there is needed to signal a temporary low is formed instead, bring a stronger rebound to 0.7590-95 but price should falter below resistance at 0.7611 and bring another decline later.
Recommendation: Target met and sell aussie again at 0.7440 for 0.7240 with stop above 0.7540.
On the weekly chart, last week’s selloff adds credence to our view that the rebound from 0.7158 has ended at 0.7750, bearishness remains for the fall from there to extend further decline to 0.7290-00 and possibly towards 0.7230, however, reckon downside would be limited to 0.7200 and price should stay well above previous support at 0.7158, risk from there is seen for a rebound to take place later.
On the upside, although initial recovery to 0.7420-30 cannot be ruled out, reckon the Kijun-Sen (now at 0.7454) would limit upside and bring another decline later. Only above last weeks high at 0.7556 would abort and signal low is formed instead, risk a stronger rebound to 0.7590-95 but break of resistance at 0.7611 is needed to add credence to this view, bring further gain towards resistance at 0.7680 but a sustained breach above this level is needed to signal the retreat from 0.7750 has ended, bring another bounce towards this level.