


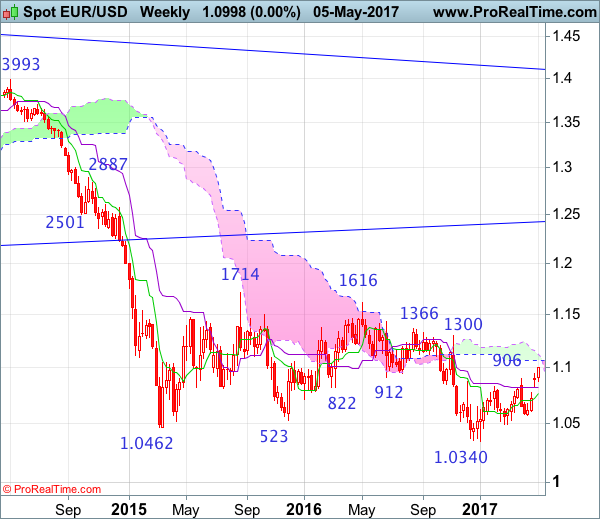
Weekly
• Last Candlesticks pattern: Shooting star
• Time of formation: 03 May 2016
• Trend bias: Down
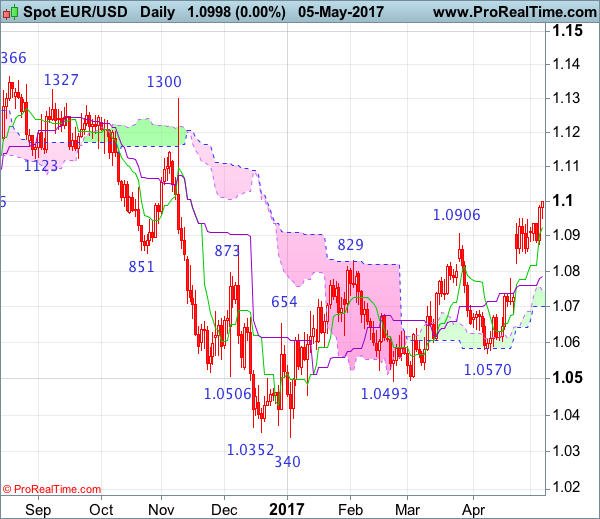
Daily
• Last Candlesticks pattern: Shooting star
• Time of formation: 3 May 2016
• Trend bias: Sideways
EUR/USD – 1.0986
The single currency has surged again after brief pullback, adding credence to our bullish view that the erratic rise from 1.0340 low is still in progress and upside bias remains for this move to extend further gain to 1.1050-60 and possibly towards 1.1100, however, reckon upside would be limited to 1.1125-30 (61.8% Fibonacci retracement of 1.1616-1.0340) and price should falter well below previous chart resistance at 1.1300, bring strong retreat later.
On the downside, whilst initial pullback to the Tenkan-Sen (now at 1.0938), then 1.0900 cannot be ruled out, reckon downside would be limited to the Kijun-Sen (now at 1.0709) and previous resistance at 1.0778 should remain intact, bring another rise later. A daily close below latter level would defer and suggest top is possibly formed, risk test of support at 1.0682 but break there is needed to add credence to this view, bring further fall to 1.0640-50. Looking ahead, only a break of 1.0600-05 would provide confirmation and suggest the aforesaid rise from 1.0340 has possibly ended, risk test of key support at 1.0570 first.
Recommendation: Buy at 1.0800 for 1.1000 with stop below 1.0700.
On the weekly chart, although the single currency has maintained a firm undertone after breaking above previous resistance at 1.0906, retaining our bullish view that he erratic rise from 1.0340 low is still in progress for retracement of recent downtrend, hence further gain to the lower Kumo (now at 1.1070), then the upper Kumo (now at 1.1097) would be seen, however, reckon upside would be limited to 1.1125-30 (61.8% Fibonacci retracement of 1.1616-1.0340) and 1.1200-10 would hold, price should falter well below strong resistance at 1.1366.
On the downside, expect pullback to be limited to support at 1.0875 and the Tnekan-Sen (now at 1.0798) should hold, bring another rise later. Only a drop below previous resistance at 1.0778 would abort and suggest top is formed instead, bring weakness to 1.0682-83 (current level of the Kijun-Sen and previous support). Below there would shift risk to the downside for further gall to 1.0570 support but only a weekly close below there would provide confirmation the aforesaid corrective rise from 1.0340 low has ended, then further decline towards key level at 1.0493 would follow.
 Turning Higher")


