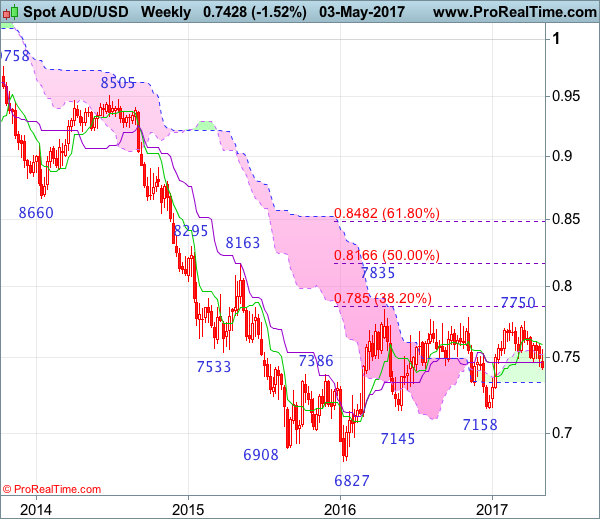
Weekly
• Last Candlesticks pattern: Shooting doji
• Time of formation: 20 Feb 2017
• Trend bias: Sideways
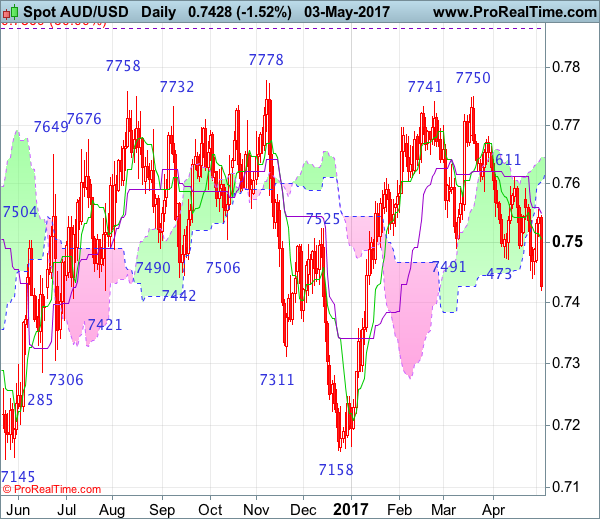
Daily
• Last Candlesticks pattern: Bearish engulfing pattern
• Time of formation: 21 Mar 2017
• Trend bias: Near term down
Although aussie recovered initially this week, renewed selling interest emerged at 0.7556 and the pair has fallen again, adding credence to our bearish view for the decline from 0.7750 to bring at least a strong retracement of the rise from 0.7158, hence further weakness to 0.7380-85 (61.8% Fibonacci retracement of 0.7158-0.7750), then towards 0.7300-10, however, near term oversold condition should prevent sharp fall below 0.7250-60 and price should stay well above support at 0.7158.
On the upside, expect recovery to be limited to 0.7440 and the Tenkan-Sen (now at 0.7493) should remain intact, bring another decline to aforesaid downside targets. Above the Kijun-Sen (now at 0.7537) would risk test of said resistance at 0.7556 but a daily close above there is needed to signal low is formed instead, risk a stronger rebound to resistance at 0.7592 and possibly test of the upper Kumo (now at 0.7645) but resistance at 0.7680 should cap upside.
Recommendation: Hold short entered at 0.7570 for 0.7390 with stop above 0.7495.
On the weekly chart, as aussie met renewed selling interest at 0.7556 earlier this week and has slipped again, another black candlestick looks set to be formed this week, retaining our bearish view that the rebound from 0.7158 has ended at 0.7750, bearishness remains for the fall from there to extend further decline to 0.7380-85 (61.8% Fibonacci retracement of 0.7158-0.7750), however, reckon downside would be limited to 0.7290-00 and 0.7230 would hold from here, bring rebound later.
On the upside, although initial recovery to 0.7440-50 cannot be ruled out, reckon 0.7495-00 would hold and bring another decline. Above 0.7556 (this week’s high) would defer and risk test of the Tenkan-Sen (now at 0.7572) but price should falter below resistance at 0.7611, bring another decline later. Only break of 0.7611 would abort and suggest low is formed instead, bring further gain towards resistance at 0.7680 but a sustained breach above this level is needed to signal the retreat from 0.7750 has ended, bring another bounce towards this level.