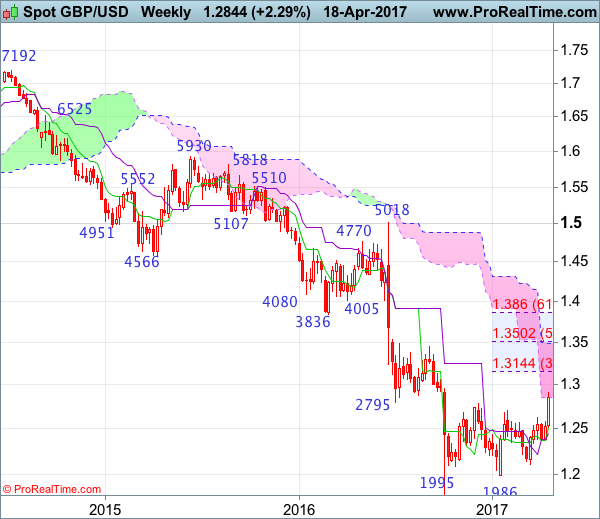
Weekly
• Last Candlesticks pattern: Long white candlestick
• Time of formation: 16 Jan 2017
• Trend bias: Down
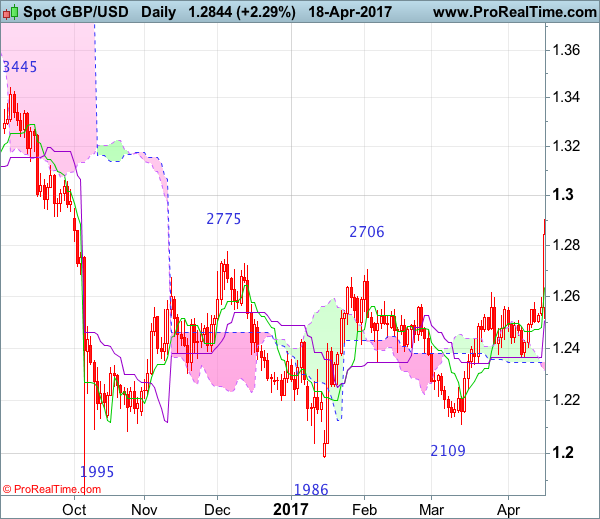
Daily
• Last Candlesticks pattern: Long white candlestick
• Time of formation: 18 Apr 2017
• Trend bias: Near term up
GBP/USD – 1.2820
Yesterday’s rally above indicated resistance at 1.2706 and 1.2775 adds credence to our view that another leg of the corrective rise from 1.1986 low (Jan low) is underway and upside bias remains for further gain to 1.2940-50, then towards 1.3000 psychological resistance, however, reckon upside would be limited to 1.3090-00 and 1.3140-50 (38.2% Fibonacci retracement of 1.5018-1.1986) would hold on first testing, risk from there is seen for a retreat to take place later.
On the downside, whilst initial pullback to 1.2705-10 cannot be ruled out, reckon downside would be limited to 1.2650-60 and bring another rise later. Below 1.2600-10 would defer and risk test of previous resistance at 1.2575, however, a daily close below this level is needed to suggest top is possibly formed, bring test of support at 1.2515. Only a drop below this level would add credence to this view, then subsequent fall towards the Kijun-Sen (now at 1.2441) but support at 1.2365 should remain intact, bring another rise later.
Recommendation: Buy at 1.2710 for 1.2910 with stop below 1.2610.
On the weekly chart, after finding renewed buying interest at 1.2365 last week, cable has rallied again this week and broke above resistance at 1.2706 as well as 1.2775, adding credence to our bullish view that the erratic rise from this year’s low at 1.1986 has resumed and near term upside bias remains for this rise to bring retracement of early decline and gain to 1.2900-10 and then 1.2940-50 would be seen, however, reckon psychological resistance at 1.3000 would limit upside and price should falter well below 1.3140-50 (38.2% Fibonacci retracement of 1.5018-1.1986), bring retreat later.
On the downside, although initial pullback to 1.2775 cannot be ruled out, reckon downside would be limited to another previous resistance at 1.2706 and bring another rise later. Below 1.2640-50 would risk test of previous resistance at 1.2616, break there would defer and suggest top is possibly formed, bring weakness to 1.2550-60 but last week’s low at 1.2515 should hold, bring another rise later. Only a drop below 1.2500 would abort and signal top is formed instead, then test of the Kijun-Sen (now at 1.2446) would follow but support at 1.2365 should remain intact.