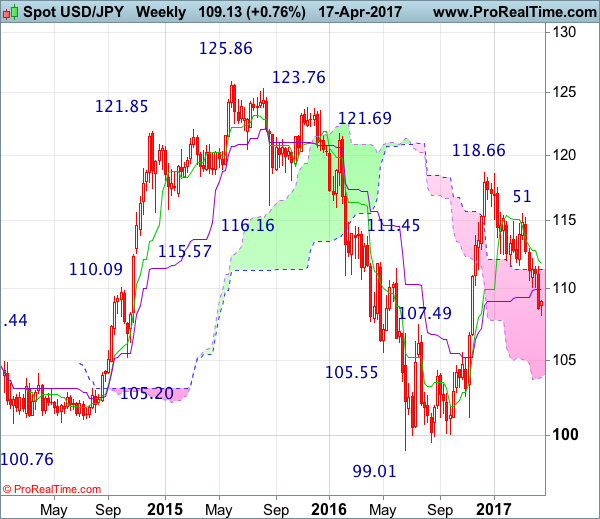
Weekly
• Last Candlesticks pattern: Marubozu
• Time of formation: 14 Nov 2016
• Trend bias: Down
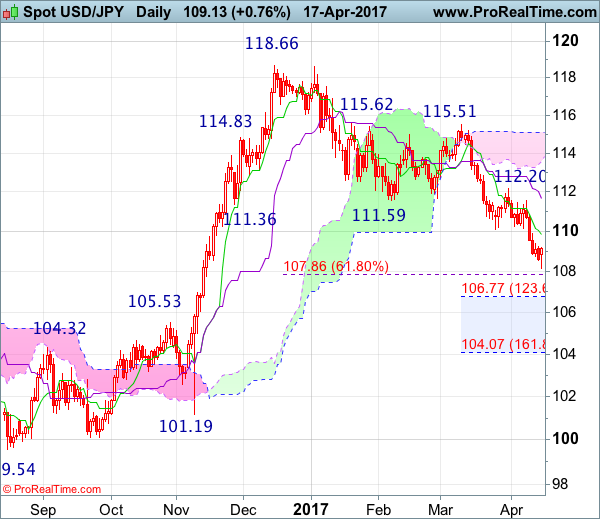
Daily
• Last Candlesticks pattern: Shooting star
• Time of formation: 15 Feb 2017
• Trend bias: Down
USD/JPY – 109.05
The greenback did meet renewed selling interest at 111.58 (a short position was met at 111.50) and dollar has fallen again in line with our bearish expectations, the indicated downside target at 109.50 was met (with 200 points profit) as price fell to as low as 108.13 yesterday before rebounding. Although this anticipated has justified our bearishness and adds credence to our view that the decline from 118.66 top is still in progress, yesterday’s rebound from 108.13 formed a hammer bullish reversal pattern on the daily chart, suggesting consolidation above this level wold be seen and corrective bounce to the Tenkan-Sen (now at 109.86) is likely, however, reckon 110.40-50 would limit upside and bring another decline later. A break of said support at 108.13 would extend recent decline to 107.85-90 (61.8% Fibonacci retracement of 101.19-118.66) and possibly 107.40-50 but oversold condition should prevent sharp fall below 106.75-80 (1.236 time projection of 118.66-111.59 measuring from 115.51) and 105.90-00 should hold, bring rebound later.
On the upside, whilst initial recovery to the Tenkan-Sen (now at 109.86) is likely, reckon upside would be limited to 110.40-50 and bring another decline later. Above said resistance at 111.58 would defer but only a daily close above the Kijun-Sen (now at 111.67) would suggest a temporary low is possibly formed, risk test of resistance at 112.20 but only a sustained breach above this level would provide confirmation, bring correction of recent selloff to 112.90 (previous resistance) and possibly towards other resistance at 113.54.
Recommendation : Our short position entered at 111.50 met target at 109.50 with 200 points profit and would sell again at 110.40 for 108.40 with stop above 111.40.
On the weekly chart, as the greenback has fallen again in line with our bearish expectation, adding credence to our view that top has been formed at 118.66 earlier and mild downside bias remains for the retreat from there to bring retracement of recent upmove, hence further weakness to 107.85-90 (61.8% Fibonacci retracement of 101.19-118.66), then towards 107.00, however, near term oversold condition should prevent sharp fall below 106.50-55 (61.8% Fibonacci retracement of 99.01-119.52) and reckon previous resistance at 105.53 (now support) would remain intact.
On the upside, although initial recovery to the Kijun-Sen (now at 109.93) cannot be ruled out, reckon upside would be limited to 110.40-50 and bring another decline. Above resistance at 111.58 would defer and risk test of the Tenkan-Sen (now at 111.82) but a weekly close above 112.20-26 resistance level is needed to signal a temporary low is formed instead, bring a stronger rebound to 113.00, then test of 113.54 resistance and possibly 114.00-10, however, price should falter well below resistance at 115.51.