


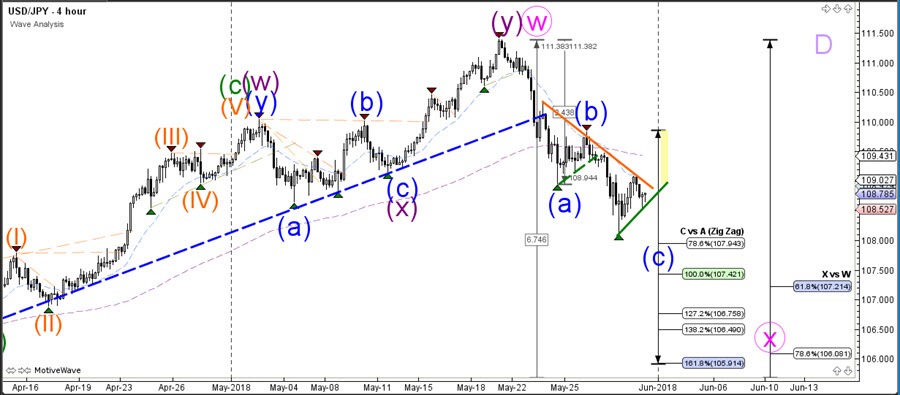
The USD/JPY is a key decision moment where price will either break above the resistance trend line or below the support trend line. The breakout direction could indicate the direction of the next swing.
The USD/JPY is probably building an ABC zigzag pattern (blue) within a larger WXY (pink) correction of a larger potential triangle on the daily chart – the wave D (light purple). A bearish breakout could indicate the continuation within the wave C (blue) whereas a bullish breakout could mean that the wave C of wave X is completed and a new bullish trend might emerge.
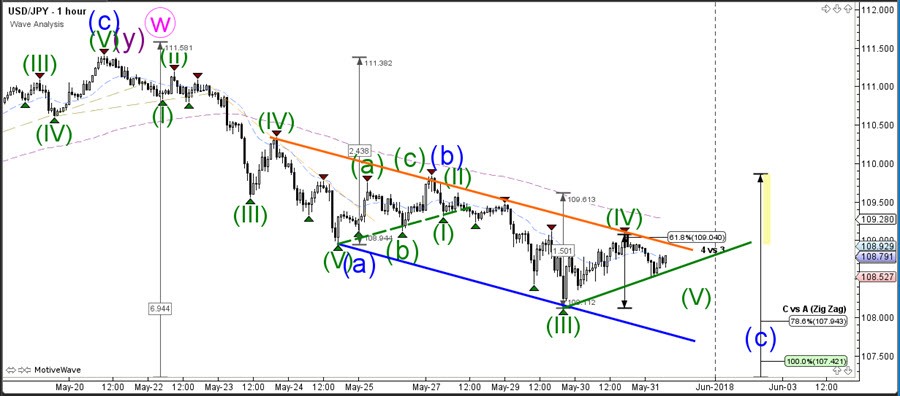
The USD/JPY downtrend is taking a pause due to the triangle chart pattern that is now emerging on the 1 hour chart.


