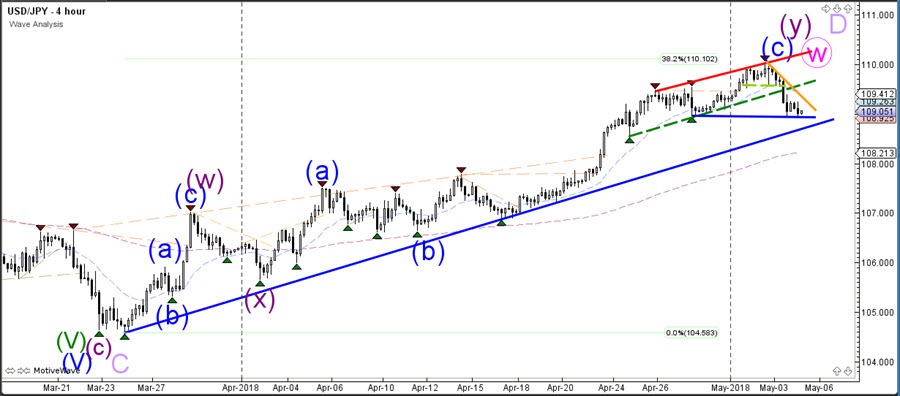
The USD/JPY made a stronger bearish bounce at the 110 round level and 38.2% Fibonacci level of potential wave D (light purple). The bearish price action could lead to a larger bearish correction for wave X (pink) but price would need to break below the support trend lines (blue) and remain below the 110 resistance spot. A break below 109 could see price fall towards 108 and 107.50 support levels.
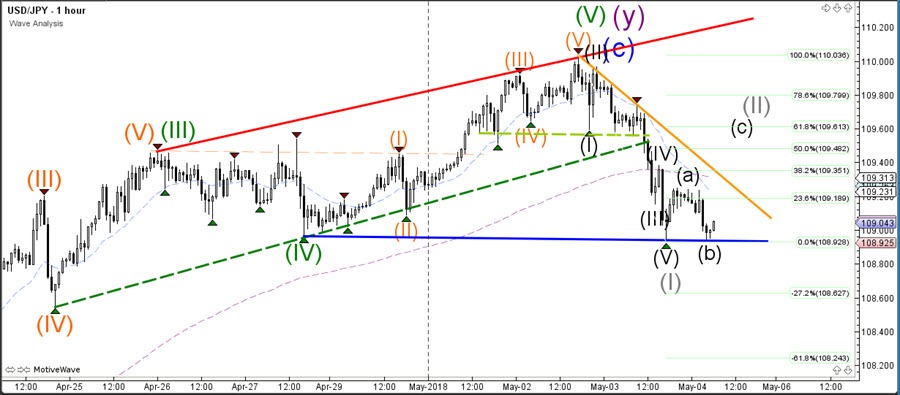
The USD/JPY is vulnerable due to the NFP event but for the moment it seems likely that price is building a wave 1-2 (grey) pattern. If that is true then price must stay below the origin (top) of wave 1 which is the 100% Fibonacci level.