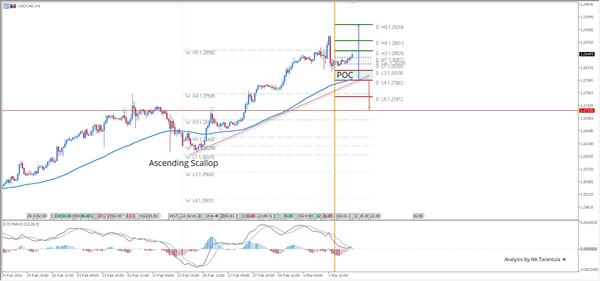
The USD/CAD has formed a bullish ascending scallop pattern after breaking out from the double top (red horizontal line). At this point the price is trying to reach D H3 pivot that indicates bullish pressure. However as today is Friday, we might see profit taking.
Traders should pay attention to POC zone 1.2790-1.2810. We could see a rejection if the price gets to POC zone. Spike above 1.2860 might target 1.2880 and 1.29290.
However if the price drops below 1.2785 targets are 1.2754 and 1.2713, and the pair will be back in consolidation mode again.
W H3 -Weekly Camarilla Pivot (Weekly Interim Resistance)
W L3 – Weekly Camarilla Pivot (Weekly Interim Support)
W H3 – Weekly Camarilla Pivot (Weekly Interim Resistance)
W H4 – Weekly Camarilla Pivot (Strong Weekly Resistance)
D H4 – Daily Camarilla Pivot (Very Strong Daily Resistance)
D L3 – Daily Camarilla Pivot (Daily Support)
D L4 – Daily H4 Camarilla (Very Strong Daily Support)
POC – Point Of Confluence (The zone where we expect price to react aka entry zone)

