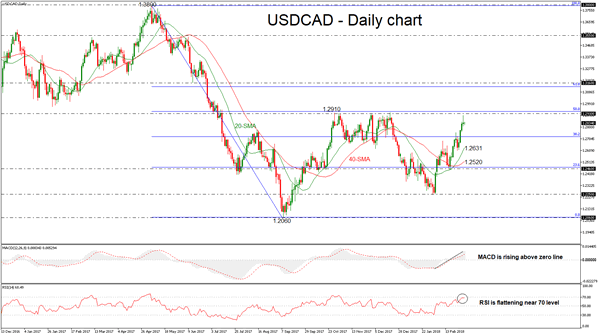
USDCAD has advanced considerably to a more than a 2-month high of 1.2895 during Thursday’s session, however, it ended the day slightly above its opening level. The price posted the fourth straight bullish day and the aggressive positive rollercoaster started after the rebound on 1.2460 support level. The short-term momentum indicators seem to be in agreement with the positive scenario.
Technically, in the daily timeframe, the MACD oscillator is rising with strong momentum above its trigger and zero lines, while the RSI indicator is flattening slightly below the overbought zone, suggesting that the latest upswing may be running out of steam and that the risk of a near-term correction is high.
In case of a break above the 1.2910 strong resistance level, which is holding near the 50.0% Fibonacci retracement level of the downleg from 1.3800 to 1.2060, the pair could extend its gains towards the 61.8% Fibonacci mark at 1.3130.
On the flip side, if the 38.2% Fibonacci level fails, then the focus could shift to the downside and USDCAD could touch the 1.2460 support barrier. As a side note, the price needs to go through the 20 and 40 simple moving averages at 1.2631 and 1.2520 respectively at the time of writing.

