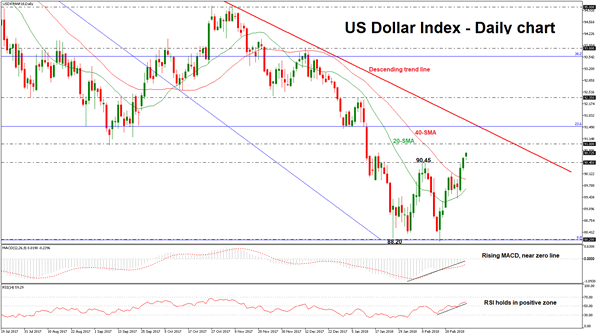
The US dollar index created a double bottom on February 16 near 88.20, posting a new more than 3-year low. The double bottom reversal is a bullish pattern indicating further gains on the price action as the index jumped above the significant area of 90.45. Currently, the price is recording a 7-week high near 90.75.
In the daily chart, short-term momentum indicators are also pointing to a continuation of the bullish bias. The Relative Strength Index is well above the 50 level, suggesting that the latest upswing may be running towards the overbought zone. The MACD oscillator is rising above the trigger line and has just entered the positive territory. In addition, the 20 simple moving averages is sloping to the upside, endorsing the upside scenario.
Further gains should see the 91.00 handle acting as a major resistance taken from the low on September 8. A run above this area could reinforce the bullish structure in the short-term as it could take the price towards the descending trend line near 91.50, which has been holding over the last year. Also, the 23.6% Fibonacci retracement level of the downleg from 102.23 to 88.20 is standing near the aforementioned level.
In the event of a continuation of the downside movement, the price could re-challenge the 88.20 support barrier, but the price would first need to go through the 20 and 40 SMAs.

