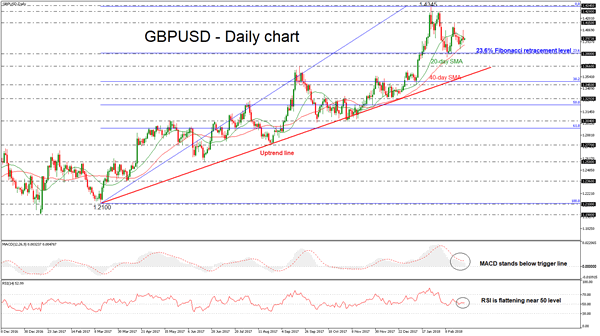
GBPUSD posted a red day on Monday, while after the sharp upward rally ended the day below its opening level. The price struggles within the 20 and 40 simple moving averages in the daily timeframe and the short-term technical indicators are bearish and point to more weakness in the market.
Looking at the daily timeframe, the Relative Strength Index (RSI) is moving in the positive territory near the 50 level but is flattening. Also, the MACD oscillator is falling below its trigger line, however, is still holding above the zero line.
If price continues the downside retracement and extends its losses, it could open the door for the 1.3800 strong psychological level, which overlaps with the 23.6% Fibonacci retracement level of the upleg from 1.2100 to 1.4345. If there is a fall below the latter level, there would be scope to test the next immediate support of 1.3660.
Conversely, if cable penetrates the 20-day SMA, it could then move towards the 1.4150 resistance level, taken from the peak on February 16. A break above the aforementioned obstacle could take the price towards the 1.4280 resistance barrier.

