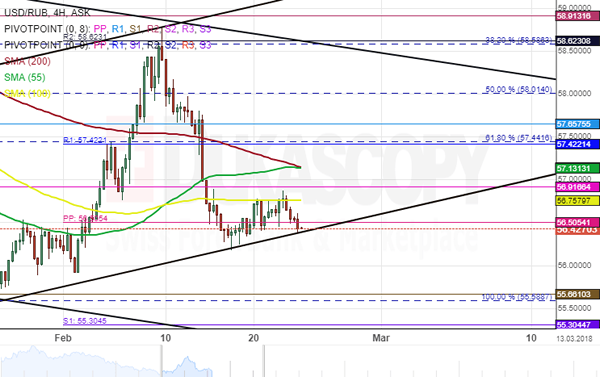
The US Dollar has started to gain strength against the Russian Ruble after the pair reached a five-years’ low of 55.58. However, the surge was stopped by the weekly R2 at 58.62.
After reaching the 38.20% Fibonacci retracement level, the exchange rate made a U-turn south and has since been trading in that direction. A new junior pattern has been drawn to monitor the price movement. This retracement can be measured by connecting the low at 55.58 and the high at 60.43.
The currency pair has moved closer to the border of the junior pattern, as can be observed on the chart. Also, technical indicators suggest a breakout of the lower boundary is likely to occur during the next trading sessions.