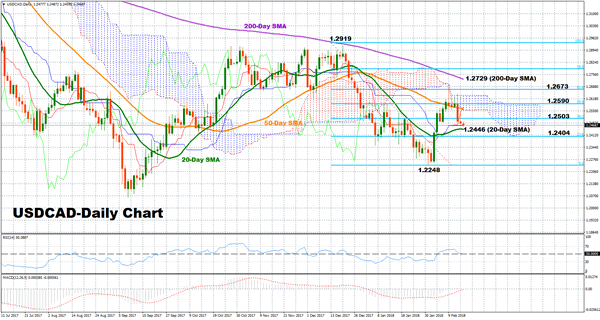
USDCAD attempted several times to cross above the 50% Fibonacci of the downleg from 1.2919 to 1.2248 but its efforts were fruitless as it finally reversed direction to test resistance at the 38.2% Fibonacci. The technical indicators now support that the short-term bias is neutral, while in the medium-term the outlook is seen bearish.
The 20-day simple moving average (SMA) has flattened, suggesting that the pair might consolidate for a while. However, if prices manage to fell below this line, a trend reversal to the downside in the near term could be close at hand. The RSI also shows that some consolidation might emerge since the index is currently attached to its neutral threshold of 50. Yet we cannot exclude any upside movements as the red Tenkan-sen line has recently crossed above the blue Kijun-sen line and is positively sloped.
Should the market head up, the 38.2% Fibonacci at 1.2503 could provide nearby resistance before the 50% Fibonacci of 1.2590 of the downleg from 1.2919 to 1.2248 come into view. The latter is seen as a stronger barrier as the area has been approached several times in the past and, while the pair would need to break the 50-day SMA as well. Therefore, a substantial close above this level would resume the recent upswing, opening the way towards the 61.8% Fibonacci of 1.2673. A leg above the 200-day SMA of 1.2729 could also increase bullish sentiment in the long-term.
To the downside, immediate support could come from the 20-day SMA at 1.2446 ahead of the 23.6% Fibonacci of 1.2404. Further below, the focus would shift to the 1.2300 key-level and the previous low of 1.2248.
Regarding the medium-term picture, the outlook is bearish as long as the market keeps trading below the 50-day SMA and the bearish crossover between the 50- and the 200-day SMA remains intact.

