correction. A break above the resistance (red) could indicate a bullish rally whereas a bearish break below support (green) would make this wave analysis unlikely and could indicate a potential downtrend.)
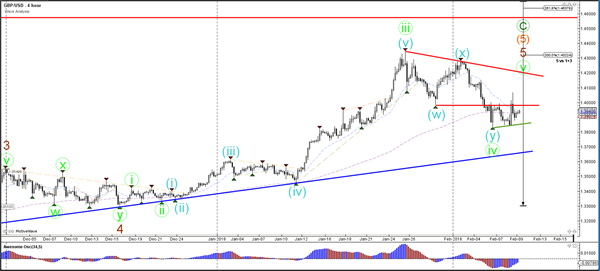
Currency pair GBP/USD
The GBP/USD is probably still in a wave 4 (green) correction. A break above the resistance (red) could indicate a bullish rally whereas a bearish break below support (green) would make this wave analysis unlikely and could indicate a potential downtrend.
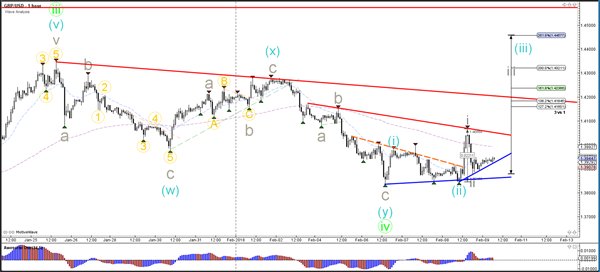
The GBP/USD made a strong move up but fell equally hard. Still, the pattern could be a wave 1-2 (grey) although a break above resistance (red) is needed before that becomes more likely. A break below the bottom of wave 1 invalidates the wave 1-2.
Currency pair EUR/USD
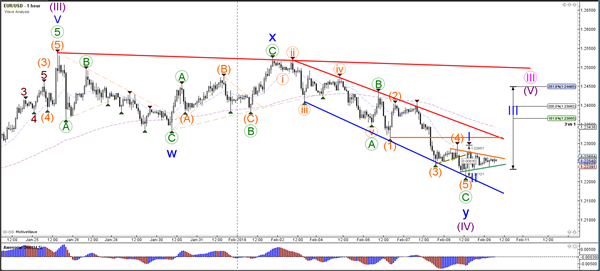
The EUR/USD remains in a bearish channel which is probably part of a wave 4 (purple) correction as long as price stays above the Fibonacci levels (purple). A break above resistance (red/orange) could see the start of a wave 5 (purple). A break below the 50-61.8% Fib support makes a wave 4 less likely.
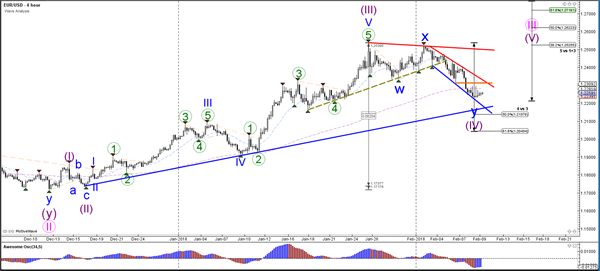
The EUR/USD indeed made one more lower low within a wave 4-5 (orange). The bullish bounce could indicate a potential bullish wave 1-2 (blue) but price would need to break above resistance to confirm a potential wave 3 (blue) breakout.
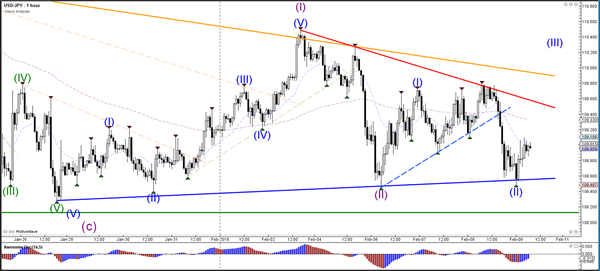
Currency pair USD/JPY
The USD/JPY is still trapped in between strong support (green/blue) and resistance (red/orange). Price could be building a wave 1-2 (purple) pattern but a bullish break is needed. A bearish break below the bottom and 100% Fib invalidates the wave 2 (purple).
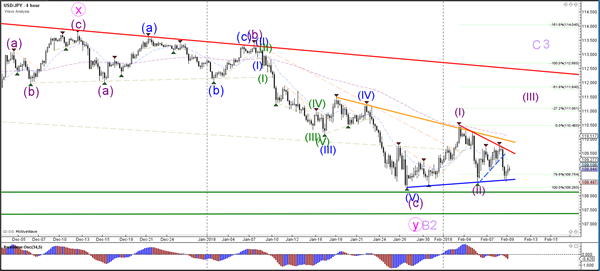
The USD/JPY needs to break above resistance (red) before an uptrend continuation is likely.