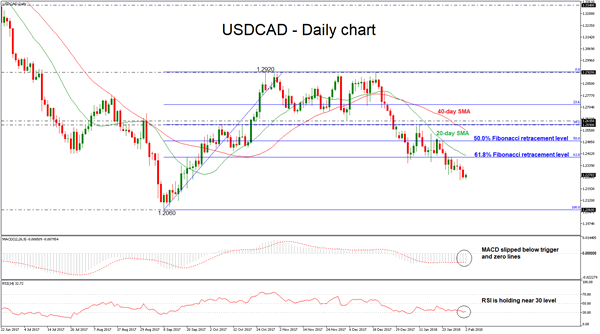
USDCAD has been developing lower over the last weekly sessions, after the strong pullback on the 1.2920 resistance level on December 19. The price broke several obstacles to the downside and ended Thursday’s session below the 1.2300 handle. Also, the short-term technical indicators are bearish and are pointing more weakness in the market.
In the daily timeframe, the RSI indicator stands in the negative territory and is flattening near the 30 level, whilst the MACD oscillator is strengthening its bearish movement as it created a downside crossover with its trigger line. In addition, the 20 and 40 simple moving averages are following the price fall.
If price remains below the 61.8% Fibonacci retracement level at 1.2390 of the up-leg from 1.2060 to 1.2920, it could open the way for the 1.2060 level, which is acting as a major support barrier, taken from the low on September 2017.
On the flip side, upside moves are likely to find resistance at 61.8% Fibonacci mark. Rising above this area, could help the pair to touch the 50.0% Fibonacci level of 1.2490. It is worth mentioning that prices need to go through the 20-day SMA before creating a significant bullish movement.

