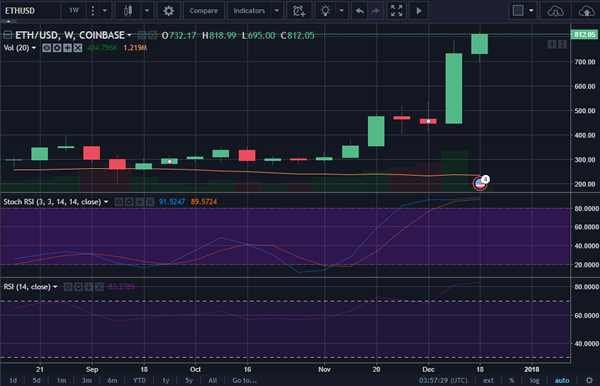
On Monday, Ether’s price soared by about 12% closing the day at $795. This followed the initial listing of Bitcoin at the CME with traders expecting ETH to be next.
Today, as of this writing, ETH is trading at $814, up 3.14%.
From a technical standpoint, ETH/USD seems overbought under these prices. As shown below, the pair’s stochastic RSI is currently at 97.89 while the 14-period RSI is at 83.99. Using RSI, an asset is considered overbought when it is trading above the 70 level. Potentially, in case of a pullback, the pair might test the $664 level or the 23% Fibonacci retracement level.
Does this suggest a new position to short the pair? No. In the current bull run, the pair has continued to go high even when the oscillator indicators are in the overbought zone. A confirmation of the current bull run can be seen in the chart below which introduces the Average Directionally Index (ADX). The pair has an ADX of 38 which is an indicator of a strong upward trend.
The pair is currently pushing towards the psychological $1,000 level which it may reach before the end of the year.

